N6-methyldeoxyadenosine marks active transcription start sites in Chlamydomonas - PubMed (original) (raw)
. 2015 May 7;161(4):879-892.
doi: 10.1016/j.cell.2015.04.010. Epub 2015 Apr 30.
Guan-Zheng Luo # 1 2, Kai Chen 1 2, Xin Deng 1 2, Miao Yu 1 2, Dali Han 1 2, Ziyang Hao 1 2, Jianzhao Liu 1 2, Xingyu Lu 1 2, Louis C Dore 1 2, Xiaocheng Weng 1 2, Quanjiang Ji 1 2, Laurens Mets 3, Chuan He 1 2
Affiliations
- PMID: 25936837
- PMCID: PMC4427561
- DOI: 10.1016/j.cell.2015.04.010
N6-methyldeoxyadenosine marks active transcription start sites in Chlamydomonas
Ye Fu et al. Cell. 2015.
Abstract
N(6)-methyldeoxyadenosine (6mA or m(6)A) is a DNA modification preserved in prokaryotes to eukaryotes. It is widespread in bacteria and functions in DNA mismatch repair, chromosome segregation, and virulence regulation. In contrast, the distribution and function of 6mA in eukaryotes have been unclear. Here, we present a comprehensive analysis of the 6mA landscape in the genome of Chlamydomonas using new sequencing approaches. We identified the 6mA modification in 84% of genes in Chlamydomonas. We found that 6mA mainly locates at ApT dinucleotides around transcription start sites (TSS) with a bimodal distribution and appears to mark active genes. A periodic pattern of 6mA deposition was also observed at base resolution, which is associated with nucleosome distribution near the TSS, suggesting a possible role in nucleosome positioning. The new genome-wide mapping of 6mA and its unique distribution in the Chlamydomonas genome suggest potential regulatory roles of 6mA in gene expression in eukaryotic organisms.
Copyright © 2015 Elsevier Inc. All rights reserved.
Figures
Figure 1. The Presence and Conservation of 6mA in Chlamydomonas Genomic DNA
(A) The presence of 6mA in isolated Chlamydomonas genomic DNA is determined by UHPLC-QQQ-MS/MS. Ratios of 6mA/A are shown (n = 6, mean ± S.E.M.). (B) The level of 6mA decreases at the beginning of S/M phase during DNA replication, and increases back to the original level at the late stage of S/M phase. During a multiple fission cell cycle in naturally synchronized cells, cells begin to replicate its DNA 1 hr after dark and divide two times, leading to ~4-fold increase of the total cell number. Ratios of 6mA/A are shown on the left axis (n = 4, mean ± S.E.M.) with calibrated cell concentration (cells/uL) shown on the right axis (n = 2, mean ± S.E.M.). See also Figure S1.
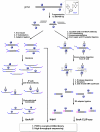
Figure 2. Schematic Diagram of 6mA-IP-seq and 6mA-CLIP-exo
For 6mA-IP-seq (left), fragmented genomic DNA (gDNA) is ligated to a Y-shaped adapter with specific index sequence, denatured, and immunoprecipitated using anti-6mA antibody. The captured DNA is eluted with 6mA single nucleotide, and PCR amplified to construct the DNA library. Simultaneously, the input library was obtained from the ligated DNA before immunoprecipitation. For 6mA-CLIP-exo (right), fragmented gDNA is incubated with anti-6mA antibody, crosslinked by 254 nm UV irritation, and immunoprecipitated. The crosslinked DNA is ligated to adapter R1 on beads, followed by 5′ to 3′ exonuclease digestion. Antibody-protected DNA is preserved, and a 2nd-strand DNA synthesis is performed after protease digestion of the antibody. A second ligation to adapter R2 provides the template for PCR amplification to construct the library for high-throughput sequencing. Boundaries were determined by the sequencing ends of the 6mA-CLIP-exo-seq to provide a high resolution localization of 6mA. See also Figure S2.
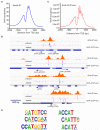
Figure 3. A Bimodal Distribution of 6mA around Transcription Start Sites
(A) Distribution of 6mA peaks around TSS measured by 6mA-IP-seq. 6mA is enriched around TSS with a bimodal distribution and a local depletion at TSS. 6mA occupancy represents the reads coverage averaged by gene number in 6mA-IP-seq. (B) Snapshot of 6mA peak determined by both 6mA-IP-seq and 6mA-CLIP-exo in specific gene loci. 6mA peaks can be detected both upstream and downstream of TSS in single direction promoter region and bidirectional promoter region. Some enrichment peaks are located in the first and second introns. Boundaries of 6mA-CLIP-exo-seq on both DNA strands were marked by magenta and blue color. Regions between the two nearest boundaries were determined as a 6mA-containing sequence. Black arrows indicate the transcription direction. (C) Distribution of 6mA peaks around TSS measured by 6mA-CLIP-exo. The enrichment of 6mA near TSS shows a similar pattern as that obtained using 6mA-IP-seq. In addition, several spikes could be observed from the large peak. (D) The dinucleotide sequence ApT is enriched in 6mA-CLIP-exo peaks, including CATG. See also Figure S3.
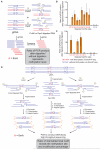
Figure 4. Single Site Detection of 6mA Using Methylation Sensitive Restriction Enzymes
(A) Schematic diagram of 6mA-RE-qPCR for validation of specific 6mA. Restriction enzymes CviAII or DpnII that are sensitive to 6mA methylation in CATG or GATC were used to digest the unmethylated CATG or GATC sites in genomic DNA, respectively. The undigested CATG or GATC sites represent the methylated fraction, and can be PCR-amplified by using primers that cover these sites. (B, C) qPCR results of 11 selected CATG sites and 7 GATC sites validated the accuracy of 6mA-IP-seq. After CviAII- or DpnII-mediated digestion, qPCR was performed using specific primers covering these sites. Relative abundances of undigested CATG or GATC sites were calculated from the ΔCt value between digested and undigested DNA samples (n = 3, mean ± S.E.M.). (D) Schematic diagram of 6mA-RE-seq. gDNA is digested with CviAII or DpnII, sonicated to small fragments around 100 base pair, and constructed into sequencing libraries. The ratio for CATG or GATC internal of sequence reads versus at the end of sequence reads of a specific genomic site represents the relative methylation to unmethylation ratio. An input sample from gDNA without CviAII- or DpnII-based digestion serves as a control. See also Figure S4 and Table S1.
Figure 5. Single-Nucleotide Resolution Map of 6mA
(A) Overlap of two 6mA-RE-seq samples under light and dark growth conditions. The majority of methylation sites were detected in both samples, indicating the consistency of this method. (B) A majority of the detected single 6mA sites by 6mA-RE-seq are covered by 6mA peaks identified by 6mA-IP-seq. (C) Overlap of 6mA sites identified by 6mA-RE-seq with the 6mA peak identified by 6mA-IP-seq. (D) 6mA occupancy around TSS normalized to the CATG and GATC distribution. A periodic pattern of 6mA around TSS could be observed for both C6mATG and G6mATC motifs. (E) Fourier transformation of 6mA distribution peaks. (F) Periods of the corresponding frequency in Fourier transformation. The dominant period length is 134.7 bp. See also Figure S5.
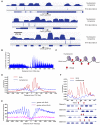
Figure 6. 6mA Resides at the DNA Linker Region between Adjacent Nucleosomes
(A) Distribution of nucleosome and 6mA in selected genes. 6mA mainly lies at the boundary region of nucleosomes. Nucleosome occupancy is shown on the first line, 6mA sites identified from 6mA-RE-seq are shown on the second line. Genome annotations are shown on the bottom line. (B) Nucleosome occupancy around 6mA sites. 0 defines the 6mA site, with downstream noted as positive. Nucleosomes reside adjacent to but not on the 6mA site. Nucleosomes downstream of 6mA sites show a constant period of ~170-180 bp. (C) Schematic models of the relationship between nucleosome distribution and 6mA in genomic DNA showing that 6mA mainly distributes in the linker DNA between two adjacent nucleosomes. (D) Distribution profiles of 6mA and nucleosome around TSS showing they are mostly inversely correlated. (E) Nucleosomes exhibit a more consistent phase in relation to TSS in genes marked with 6mA than genes without 6mA. (F) Schematic illustration of the relationship between nucleosome positioning and 6mA location in individual genes. 6mA does not reside on nucleosome-wrapped DNA. See also Figure S6.
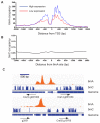
Figure 7. Correlation of 6mA with Active Genes
(A) The 6mA methylation is correlated with active genes. Two groups of genes with high (FPKM ≥ 1) and low (FPKM <1) expression levels are plotted with its methylation level determined from 6mA-CLIP-exo-seq. 6mA occupancy represents the reads coverage that are normalized to gene counts of each category in 6mA-CLIP-exo. FPKM stands for Fragments Per Kilobase Of Exon Per Million Fragments Mapped. (B) No correlation was observed between the distributions of 5mC and 6mA. Distance between 5mC and 6mA was plotted, showing no correlation between the two. (C) Selected examples showing that 5mC mainly appears in the gene body, while 6mA mainly resides near TSS region. 6mA peaks identified from 6mA-IP-seq are shown on the first line, 5mC sites identified from previous results are shown on the second line. Genome annotations are shown on the bottom line. See also Figure S7.
Similar articles
- Widespread adenine N6-methylation of active genes in fungi.
Mondo SJ, Dannebaum RO, Kuo RC, Louie KB, Bewick AJ, LaButti K, Haridas S, Kuo A, Salamov A, Ahrendt SR, Lau R, Bowen BP, Lipzen A, Sullivan W, Andreopoulos BB, Clum A, Lindquist E, Daum C, Northen TR, Kunde-Ramamoorthy G, Schmitz RJ, Gryganskyi A, Culley D, Magnuson J, James TY, O'Malley MA, Stajich JE, Spatafora JW, Visel A, Grigoriev IV. Mondo SJ, et al. Nat Genet. 2017 Jun;49(6):964-968. doi: 10.1038/ng.3859. Epub 2017 May 8. Nat Genet. 2017. PMID: 28481340 - N6-methyldeoxyadenosine directs nucleosome positioning in Tetrahymena DNA.
Luo GZ, Hao Z, Luo L, Shen M, Sparvoli D, Zheng Y, Zhang Z, Weng X, Chen K, Cui Q, Turkewitz AP, He C. Luo GZ, et al. Genome Biol. 2018 Nov 19;19(1):200. doi: 10.1186/s13059-018-1573-3. Genome Biol. 2018. PMID: 30454035 Free PMC article. - Characterization of eukaryotic DNA N(6)-methyladenine by a highly sensitive restriction enzyme-assisted sequencing.
Luo GZ, Wang F, Weng X, Chen K, Hao Z, Yu M, Deng X, Liu J, He C. Luo GZ, et al. Nat Commun. 2016 Apr 15;7:11301. doi: 10.1038/ncomms11301. Nat Commun. 2016. PMID: 27079427 Free PMC article. - The epigenetic roles of DNA N6-Methyladenine (6mA) modification in eukaryotes.
Wu KJ. Wu KJ. Cancer Lett. 2020 Dec 1;494:40-46. doi: 10.1016/j.canlet.2020.08.025. Epub 2020 Aug 23. Cancer Lett. 2020. PMID: 32846189 Review. - DNA N(6)-methyladenine: a new epigenetic mark in eukaryotes?
Luo GZ, Blanco MA, Greer EL, He C, Shi Y. Luo GZ, et al. Nat Rev Mol Cell Biol. 2015 Dec;16(12):705-10. doi: 10.1038/nrm4076. Epub 2015 Oct 28. Nat Rev Mol Cell Biol. 2015. PMID: 26507168 Free PMC article. Review.
Cited by
- DNC4mC-Deep: Identification and Analysis of DNA N4-Methylcytosine Sites Based on Different Encoding Schemes By Using Deep Learning.
Wahab A, Mahmoudi O, Kim J, Chong KT. Wahab A, et al. Cells. 2020 Jul 22;9(8):1756. doi: 10.3390/cells9081756. Cells. 2020. PMID: 32707969 Free PMC article. - DNA Modification Patterns within the Transposable Elements of the Fig (Ficus carica L.) Genome.
Usai G, Vangelisti A, Simoni S, Giordani T, Natali L, Cavallini A, Mascagni F. Usai G, et al. Plants (Basel). 2021 Feb 27;10(3):451. doi: 10.3390/plants10030451. Plants (Basel). 2021. PMID: 33673593 Free PMC article. - Light Dependent Changes in Adenylate Methylation of the Promoter of the Mitochondrial Citrate Synthase Gene in Maize (Zea mays L.) Leaves.
Eprintsev AT, Fedorin DN, Igamberdiev AU. Eprintsev AT, et al. Int J Mol Sci. 2022 Nov 4;23(21):13495. doi: 10.3390/ijms232113495. Int J Mol Sci. 2022. PMID: 36362281 Free PMC article. - A distinct class of eukaryotic MT-A70 methyltransferases maintain symmetric DNA N6-adenine methylation at the ApT dinucleotides as an epigenetic mark associated with transcription.
Wang Y, Sheng Y, Liu Y, Zhang W, Cheng T, Duan L, Pan B, Qiao Y, Liu Y, Gao S. Wang Y, et al. Nucleic Acids Res. 2019 Dec 16;47(22):11771-11789. doi: 10.1093/nar/gkz1053. Nucleic Acids Res. 2019. PMID: 31722409 Free PMC article. - The SWC4 subunit of the SWR1 chromatin remodeling complex is involved in varying virulence of Metarhizium brunneum isolates offering role of epigenetic regulation of pathogenicity.
Reingold V, Staropoli A, Faigenboim A, Maymone M, Matveev S, Keppanan R, Ghanim M, Vinale F, Ment D. Reingold V, et al. Virulence. 2022 Dec;13(1):1252-1269. doi: 10.1080/21505594.2022.2101210. Virulence. 2022. PMID: 35891589 Free PMC article.
References
- Bird A. Perceptions of epigenetics. Nature. 2007;447:396–398. - PubMed
Publication types
MeSH terms
Substances
LinkOut - more resources
Full Text Sources
Other Literature Sources
Molecular Biology Databases

