FTY720 attenuates excitotoxicity and neuroinflammation - PubMed (original) (raw)
FTY720 attenuates excitotoxicity and neuroinflammation
Raffaela Cipriani et al. J Neuroinflammation. 2015.
Abstract
Background: FTY720 (fingolimod, Gilenya™), a structural analog of sphingosine-1-phosphate (S1P), is the first oral drug approved for treatment the relapsing-remitting form of multiple sclerosis (MS), and its efficacy has been related to induced lymphopenia and consequent immunosuppression via modulation of S1P1 receptors (S1P1R). However, due to its lipophilic nature, FTY720 crosses the blood brain barrier (BBB) and could act directly on neural cells. In this study, we investigated the effectiveness of FTY720 as a neuroprotective agent using in vitro and in vivo models of excitotoxic neuronal death and examined if FTY720 exerts a direct action on neurons, or/and an indirect modulation of inflammation-mediated neurodegeneration as a possible mechanism of neuroprotection.
Methods: Primary neuronal and organotypic cortical cultures were treated with N-methyl-D-aspartic acid (NMDA) to induce excitotoxic cell death (measured by lactate dehydrogenase (LDH) assay or propidium iodide uptake, respectively). The effects of FTY720 treatment (10, 100 and 1,000 nM) on neuronal survival were examined. As an in vivo model of neuronal death and inflammation, we used intracerebroventricular (icv) administration of kainic acid (KA; 0.5 μg/2 μl) in Sprague-Dawley rats. FTY720 was applied icv (1 μg/2 μl), together with KA, plus intraperitoneally (ip; 1 mg/kg) 24 h before, and daily, until sacrifice 3 days after icv. Rats were evaluated for neurological score, neuronal loss in CA3 hippocampal region and activation of microglia at the lesion site. In addition, we tested FTY720 as a modulator of microglia responses using microglial cell cultures activated with lipopolysaccharide (LPS) and its effects in stress signalling pathways using western blotting for p38 and JNK1/2 mitogen-activated protein kinases (MAPKs).
Results: FTY720 was able to reduce excitotoxic neuronal death in vitro. Moreover, in vivo repeated FTY720 administration attenuated KA-induced neurodegeneration and microgliosis at the CA3 lesion site. Furthermore, FTY720 negatively modulates p38 MAPK in LPS-activated microglia, whereas it had no effect on JNK1/2 activation.
Conclusions: These data support a role for FTY720 as a neuroprotective agent against excitotoxin-induced neuronal death and as a negative modulator of neuroinflammation by targeting the p38 MAPK stress signalling pathway in microglia.
Figures
Figure 1
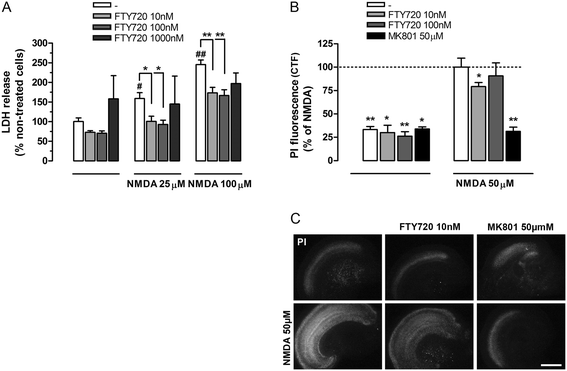
FTY720 prevents excitotoxic neuronal death in cerebrocortical primary and organotypic cultures. (A) Neuronal primary cultures 9 DIV were pre-treated with increased concentration of FTY720 (10 to 1,000 nM) for 24 h and then stimulated with N-methyl-D-aspartic acid (NMDA) (25 to 100 μM) in the same conditioned medium. After 24 h of NMDA treatment, lactate dehydrogenase (LDH) released in the medium was measured and mean ± SEM were reported as per cent of non-treated neurons (n = 6, except for FTY720 1 μM, n = 2; two-way ANOVA: * or # P < 0.05; ** or ## P < 0.01; # vs control). (B) Organotypic cultures were pre-treated 24 h with FTY720 (10 and 100 nM) and then incubated with NMDA (50 μM) for 30 min, in the presence or in the absence of FTY720 or MK801 (50 μM, 10 min pre-incubation). FTY720 was added for additional 24 h. The damage was detected by PI uptake 24 h after treatment with NMDA and propidium iodide (PI) intensity was measured as corrected total fluorescence (CTF). Data are expressed as the mean ± SEM (n ≥ 4 independent experiments; in each experiment, at least two slices for condition were used) and referred to percent of NMDA-treated neurons (dotted line). Student’s t test: *P < 0.05 and **P < 0.01 vs NMDA-treated cells. (C) Representative photographs showing PI uptake in cortical slices treated as in (B). Scale bar: 1 mm.
Figure 2
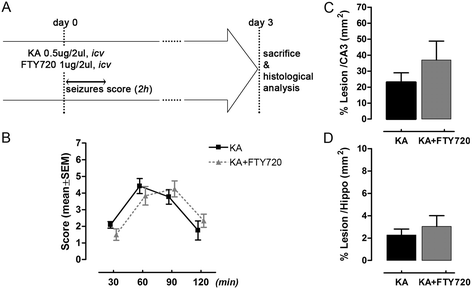
Single acute treatment with FTY720 does not protect from kainic acid (KA)-induced neurodegeneration in vivo. (A) Schematic timeline of experimental protocol. FTY720 was applied as a single icv dose together with KA. Seizure score was evaluated at the end of the surgery observing the animals during 30 min intervals over a period of 2 h. Animals were sacrificed 3 days after icv injection and brain tissues processed for immunohistochemical analysis. (B) Effect of FTY720 (1 μg/2 μl, icv) on seizure-like behaviour induced by KA icv injection (0.5 μg/2 μl). Seizure was scored as described in the ‘Methods’ section, with the higher score indicating greater seizure severity. The mean seizure score for KA group (n = 6) and KA + FTY720 group (n = 6) was plotted against time after icv. (C, D) Quantification of the extent of the lesion in animal icv injected with KA (n = 6) and KA + FTY720 (n = 6) after Nissl’s staining. Eight slices per animal were evaluated. Area of the lesion and areas of CA3 and hippocampus were measured for each slice (mm2) in the ipsilateral side. The mean lesion area per animal was calculated and normalized to the mean CA3 or hippocampal areas (C, D). Data are expressed as the mean ± SEM of n = 6 animals for each experimental group (two independent experiments with 3 animals in each group). There is no significant difference between the two groups (B: Mann–Whitney test at any time point of recorded seizure score; C and D: Student’s t test).
Figure 3
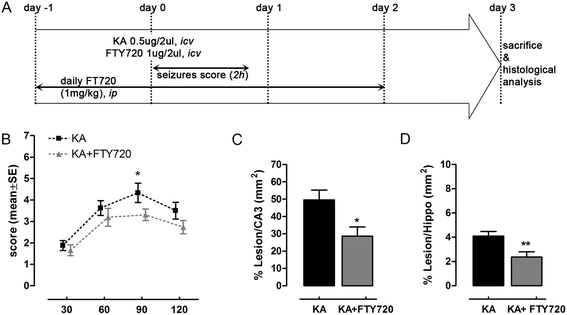
Repeated (daily) treatment with FTY720 protects from kainic acid (KA)-induced neurodegeneration in vivo. (A) Schematic timeline of experimental protocol. FTY720 or vehicle was ip injected (1 mg/kg) daily, starting 1 day before icv surgery up to 2 days thereafter. Animals received a single icv injection of KA alone (0.5 μg/2 μl) or in combination with FTY720 (1 μg/2 μl). Seizure score was evaluated post-surgery at 30-min intervals over a period of 2 h. On day 3 after icv injection, animals were sacrificed and brain tissues processed for immunohistochemical analysis. (B) Effect of daily FTY720 treatment on seizure-like behaviour induced by KA icv injection. Seizure was scored as described in the ‘Methods’ section, with the higher score indicating greater seizure severity. The mean seizure score for KA group (n = 12, four independent experiments with 3 animals each) and KA + FTY720 group (n = 13, four independent experiments with ≥3 animals each) was plotted against time after icv. *P < 0.05 vs KA-treated group, Mann–Whitney test at any time point of recorded seizure score. (C, D) Quantification of the extent of the lesion in animal icv injected with KA (n = 11) and KA + FTY720 (n = 12) after Nissl’s staining. Eight slices per animal were evaluated. Area of the lesion and areas of CA3 and hippocampus were measured for each slice (mm2) in the ipsilateral side. The mean lesion area per animal was calculated and normalized to the mean CA3 or hippocampal areas (C, D). Only ipsilateral hemisphere was considered for the analysis. *P < 0.05 and **P < 0.01 vs KA-treated group, Student’s t test. All data are expressed as the mean ± SEM of n ≥ 11 animals for each experimental group (four independent experiments).
Figure 4
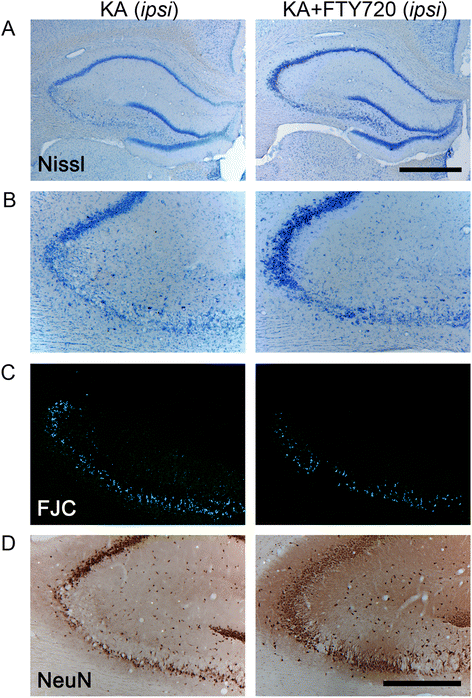
Histological analysis of the protective effect of FTY720 in CA3 region following icv injection of kainic acid (KA). Slices collected 3 days after icv surgery were stained with Nissl (A, B), Fluoro-Jade C (FJC) (C), and anti-NeuN antibody (D). Figure shows representative photomicrographs of bright field (A, B, D) and epifluorescence (C) microscopy images obtained from coronal sections of KA-treated (left panel) and KA + FTY720-treated animal groups (right panel). Only the damaged ipsilateral hemisphere is shown. KA-induced cell death is evident in the CA3 region, as indicated by Nissl’s staining (A, B), lower number of NeuN+ cells (D), and increased density of FJC+ neurons (C). KA + FTY720-treated group (right panel) shows significant attenuated loss of neurons as compared to KA-treated group (left panel). (A) Dorsal ipsilateral hippocampus. Scale bar: 1 mm. (B-D) CA3 region of ipsilateral hippocampus. Scale bar 500 μm.
Figure 5
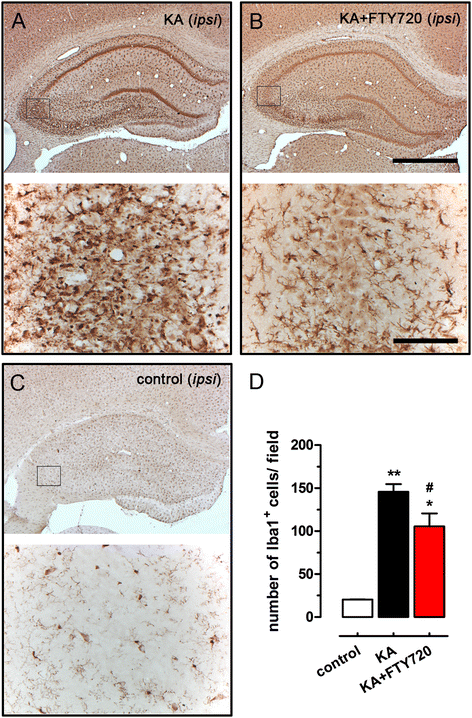
FTY720 reduces microgliosis in CA3 region after icv injection of kainic acid (KA). Representative photomicrographs of ipsilateral hippocampal coronal sections of KA-treated (A), KA + FTY720-treated (B) and control (C) animal groups, immunostained with anti-Iba1 antibody (bright field microscopy). Images on the top of each panel are low magnification photomicrographs showing the entire ipsilateral dorsal hippocampus (scale bar 1 mm). The black frame represents the size field used for counting Iba1+ microglial cells in the CA3 region. Images on the bottom of each panel illustrate the area used for microglial cell counting (scale bar 100 μm). (D) Quantification of the number of Iba1+ microglial cells at CA3 region in control, KA-treated and KA + FTY720-treated animals. Three fields per slice were used to cover the CA3 region and to count the Iba1+ microglial cells at the site of injury, and a total of three slices per animal were analysed. Data are expressed as the mean ± SEM of positive cells in ipsilateral CA3 region per slice (control: n = 2; KA and KA + FTY720 n = 9 from three independent sets of experiments). Student’s t test: *P < 0.05 and **P < 0.01 vs control; # P < 0.05 vs KA.
Figure 6
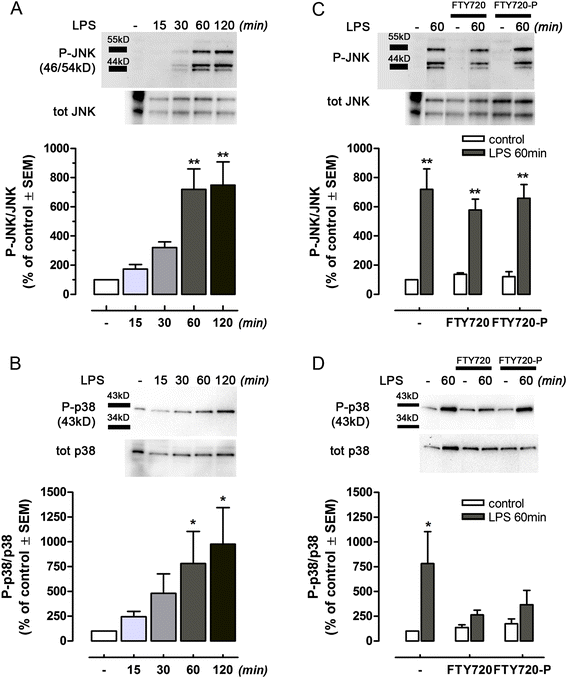
FTY720 modulates inflammatory responses of lipopolysaccharide (LPS)-activated microglia. Microglial cells treated with LPS (100 ng/ml, DMEM without serum) showed time-dependent phosphorylation of JNK (A) and p38 (B) MAPKs, as determined by Western blot analysis. (C) Pre-treatment for 24 h with FTY720 or FY720-P did not reduce LPS-induced phosphorylation of JNK at 60 min, while a significantly effect was shown on LPS-induced p38 activation at the same time point (D). Levels of phosphorylated target protein were normalized to the expression of the corresponding non-phosphorylated form and expressed as percent of untreated cells. The insets on the top of each graph show corresponding, representative Western blots. Lanes have been cropped from the original gel, and minimal adjustments were made to the brightness and contrast settings to improve the clarity of the figure. All lanes shown are from the same gel. Original uncropped blots are shown in Additional file 1: Figure S1. Values are given as mean ± SEM, n ≥ 3. Statistical analysis: A and B, one-way ANOVA, *P < 0.05 or **P < 0.01 vs untreated cells; C and D, two-tailed t test, *P < 0.05 or **P < 0.01 vs internal control without LPS.
Similar articles
- Effects of FTY720 on brain neurogenic niches in vitro and after kainic acid-induced injury.
Cipriani R, Chara JC, Rodríguez-Antigüedad A, Matute C. Cipriani R, et al. J Neuroinflammation. 2017 Jul 24;14(1):147. doi: 10.1186/s12974-017-0922-6. J Neuroinflammation. 2017. PMID: 28738875 Free PMC article. - Fingolimod protects cultured cortical neurons against excitotoxic death.
Di Menna L, Molinaro G, Di Nuzzo L, Riozzi B, Zappulla C, Pozzilli C, Turrini R, Caraci F, Copani A, Battaglia G, Nicoletti F, Bruno V. Di Menna L, et al. Pharmacol Res. 2013 Jan;67(1):1-9. doi: 10.1016/j.phrs.2012.10.004. Epub 2012 Oct 13. Pharmacol Res. 2013. PMID: 23073075 - Development of kainic acid and N-methyl-D-aspartic acid toxicity in organotypic hippocampal cultures.
Bruce AJ, Sakhi S, Schreiber SS, Baudry M. Bruce AJ, et al. Exp Neurol. 1995 Apr;132(2):209-19. doi: 10.1016/0014-4886(95)90026-8. Exp Neurol. 1995. PMID: 7540554 - The use of propidium iodide to assess excitotoxic neuronal death in primary mixed cortical cultures.
Lau AC, Cui H, Tymianski M. Lau AC, et al. Methods Mol Biol. 2007;399:15-29. doi: 10.1007/978-1-59745-504-6_2. Methods Mol Biol. 2007. PMID: 18309922 Review. - Beneficial Effects of Fingolimod in Alzheimer's Disease: Molecular Mechanisms and Therapeutic Potential.
Angelopoulou E, Piperi C. Angelopoulou E, et al. Neuromolecular Med. 2019 Sep;21(3):227-238. doi: 10.1007/s12017-019-08558-2. Epub 2019 Jul 16. Neuromolecular Med. 2019. PMID: 31313064 Review.
Cited by
- Could α-Synuclein Modulation of Insulin and Dopamine Identify a Novel Link Between Parkinson's Disease and Diabetes as Well as Potential Therapies?
Vidal-Martinez G, Yang B, Vargas-Medrano J, Perez RG. Vidal-Martinez G, et al. Front Mol Neurosci. 2018 Dec 21;11:465. doi: 10.3389/fnmol.2018.00465. eCollection 2018. Front Mol Neurosci. 2018. PMID: 30622456 Free PMC article. Review. - Mfsd2a and Spns2 are essential for sphingosine-1-phosphate transport in the formation and maintenance of the blood-brain barrier.
Wang Z, Zheng Y, Wang F, Zhong J, Zhao T, Xie Q, Zhu T, Ma F, Tang Q, Zhou B, Zhu J. Wang Z, et al. Sci Adv. 2020 May 29;6(22):eaay8627. doi: 10.1126/sciadv.aay8627. eCollection 2020 May. Sci Adv. 2020. PMID: 32523984 Free PMC article. - Combination of the Immune Modulator Fingolimod With Alteplase in Acute Ischemic Stroke: A Pilot Trial.
Zhu Z, Fu Y, Tian D, Sun N, Han W, Chang G, Dong Y, Xu X, Liu Q, Huang D, Shi FD. Zhu Z, et al. Circulation. 2015 Sep 22;132(12):1104-1112. doi: 10.1161/CIRCULATIONAHA.115.016371. Epub 2015 Jul 22. Circulation. 2015. PMID: 26202811 Free PMC article. Clinical Trial. - FTY720 Attenuates 6-OHDA-Associated Dopaminergic Degeneration in Cellular and Mouse Parkinsonian Models.
Ren M, Han M, Wei X, Guo Y, Shi H, Zhang X, Perez RG, Lou H. Ren M, et al. Neurochem Res. 2017 Feb;42(2):686-696. doi: 10.1007/s11064-016-2125-4. Epub 2016 Dec 9. Neurochem Res. 2017. PMID: 27943027 - Therapeutic Strategies Under Development Targeting Inflammatory Mechanisms in Amyotrophic Lateral Sclerosis.
Crisafulli SG, Brajkovic S, Cipolat Mis MS, Parente V, Corti S. Crisafulli SG, et al. Mol Neurobiol. 2018 Apr;55(4):2789-2813. doi: 10.1007/s12035-017-0532-4. Epub 2017 Apr 28. Mol Neurobiol. 2018. PMID: 28455693 Review.
References
Publication types
MeSH terms
Substances
LinkOut - more resources
Full Text Sources
Other Literature Sources
Medical
Research Materials
Miscellaneous
