Inhibition of UCH-L1 in oligodendroglial cells results in microtubule stabilization and prevents α-synuclein aggregate formation by activating the autophagic pathway: implications for multiple system atrophy - PubMed (original) (raw)
Inhibition of UCH-L1 in oligodendroglial cells results in microtubule stabilization and prevents α-synuclein aggregate formation by activating the autophagic pathway: implications for multiple system atrophy
Katharina Pukaß et al. Front Cell Neurosci. 2015.
Abstract
α-Synuclein (α-syn) positive glial cytoplasmic inclusions (GCI) originating in oligodendrocytes (ODC) are a characteristic hallmark in multiple system atrophy (MSA). Their occurrence may be linked to a failure of the ubiquitin proteasome system (UPS) or the autophagic pathway. For proteasomal degradation, proteins need to be covalently modified by ubiquitin, and deubiquitinated by deubiquitinating enzymes (DUBs) before proteolytic degradation is performed. The DUB ubiquitin carboxyl-terminal hydrolase L1 (UCH-L1) is a component of the UPS, it is abundantly expressed in neuronal brain cells and has been connected to Parkinson's disease (PD). It interacts with α-syn and tubulin. The present study was undertaken to investigate whether UCH-L1 is a constituent of ODC, the myelin forming cells of the CNS, and is associated with GCIs in MSA. Furthermore, LDN-57444 (LDN), a specific UCH-L1 inhibitor, was used to analyze its effects on cell morphology, microtubule (MT) organization and the proteolytic degradation system. Towards this an oligodendroglial cell line (OLN cells), stably transfected with α-syn or with α-syn and GFP-LC3, to monitor the autophagic flux, was used. The data show that UCH-L1 is expressed in ODC derived from the brains of newborn rats and colocalizes with α-syn in GCIs of MSA brain sections. LDN treatment had a direct impact on the MT network by affecting tubulin posttranslational modifications, i.e., acetylation and tyrosination. An increase in α-tubulin detyrosination was observed and detyrosinated MT were abundantly recruited to the cellular extensions. Furthermore, small α-syn aggregates, which are constitutively expressed in OLN cells overexpressing α-syn, were abolished, and LDN caused the upregulation of the autophagic pathway. Our data add to the knowledge that the UPS and the autophagy-lysosomal pathway are tightly balanced, and that UCH-L1 and its regulation may play a role in neurodegenerative diseases with oligodendroglia pathology.
Keywords: GFP-LC3; deubiquitinating enzymes; glial cell inclusions; glial cells; tubulin tyrosination.
Figures
Figure 1
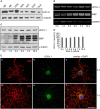
The deubiquitinase UCH-L1 is expressed in rat brain oligodendrocytes (ODC). (A) Immunoblot analysis. Cell extracts of human brain (HB), rat brain (RB), dorsal root ganglion neurons (DRG), N2A cells (N2A), astrocytes (AST), primary rat brain ODC, and OLN-93 cells (OLN) were subjected to immunoblot procedure using the antibodies as indicated on the right. (B) mRNA analysis. ODC were cultured for the indicated times. mRNA was extracted and subjected to RT-PCR. UCH-L1 was analyzed in relation to Glyceraldehyde-3-phosphate-Dehydrogenase (GAPDH) and Myelin basic protein (MBP) mRNA. The PCR-products representing the different mRNAs are marked on the right. (C) ODC were cultured for the indicated times. Cell extracts were subjected to immunoblot procedure using the antibodies as indicated on the right. (D) Quantitative evaluation of the blot shown in (C) was carried out using ImageQuant software. Data represent the mean ± SD from three independent experiments. UCH-L1 levels were normalized to α-tubulin and the total amount of the control was set to 100%. Statistical evaluation was carried out by Student’s _t_-test: the differences are not significant. (E) Indirect immunofluorescent staining. ODC were cultured for 3 or 7 days. Indirect immunofluorescence staining was carried out with antibodies against the chondroitin sulfate proteoglycan NG2 (a), 2′, 3′-cyclic nucleotide 3′-phosphodiesterase (CNP; d), and UCH-L1 (green). Nuclei were stained with DAPI (blue). Scale bar: 20 μm.
Figure 2
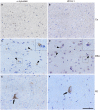
α-Synuclein and UCH-L1 are present in Lewy bodies and glial cytoplasmic inclusions. Immunohistochemistry of pontine sections using antibodies against α-syn (LB509) and UCH-L1, as indicated on the top, was carried out. The results reveal that glial cytoplasmic inclusions (arrow heads) and Lewy bodies (arrows), which do not occur in unaffected brain used as a control (Co) (A,B), positively stain for α-syn (C,E) and UCH-L1 (D,F). Scale bar: 50 μm.
Figure 3
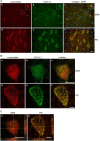
Colocalization of α-synuclein and UCH-L1 in glial cytoplasmic inclusions and Lewy bodies. (A) Double label immunohistochemistry of sections of multiple system atrophy (MSA) (a–c) and Parkinson’s disease (PD) brains (d–f) using antibodies against α-syn (LB509) and UCH-L1 (PGP 9.5), as indicated on the top. Overlay with DAPI (blue). Scale bar: 20 μm. (B) Confocal images (one section: 0.3 μm) of a glial cytoplasmic inclusion (a–c) and a Lewy body (d–f) at a higher magnification are shown. Scale bar: 5 μm. (C) Three dimensional reconstructions of confocal images (18 sections in a; 36 sections in b) corroborate that α-syn and UCH-L1 colocalize in GCIs and LBs (marked by a yellow cross). Reconstructed orthogonal projections are presented as viewed in the x-z (bottom) and y-z (right) planes. Scale bar: 5 μm.
Figure 4
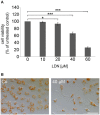
The specific UCH-L1 inhibitor LDN causes concentration dependent cell death in oligodendroglial cells. (A) Neutral red (NR) survival assay of OLN-t40-α-syn cells exposed to increasing concentrations of LDN. Cells were treated with 0–60 μM LDN for 18 h. Cell viability was determined by NR uptake. Data are expressed as percentage of untreated control cells. Values represent the means ± SD of 16 microwells of two independent experiments (n = 32). *p < 0.05 significant and ***p < 0.001 highly significant. (B) Cells were incubated with 40 μM LDN for 18 h (Co, untreated control). Thereafter cells were incubated with medium containing 0.005% NR and photographed. Scale bar: 100 μm.
Figure 5
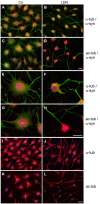
LDN induces reorganization of microtubules and the clearance of α-synuclein puncta in oligodendroglial cells overexpressing α-synuclein. OLN-t40-α-syn cells (A–H) or OLN-93 cells (I–L), not expressing α-syn or tau, were incubated with 40 μM LDN for 18 h (Co, untreated control). OLN-t40-α-syn cells were subjected to indirect immunofluorescence staining with antibodies against α-syn (red) and α-tubulin (α-tub; green) or acetylated α-tubulin (ac-tub; green) (A–H, as indicated), OLN-93 cells with antibodies against α-tub (red) or ac-tub (red) as indicated. Nuclei were stained with DAPI (blue). Overlay images are shown. Scale bar: 20 μm.
Figure 6
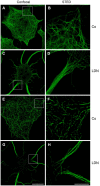
Microtubule bundling and acetylation after LDN treatment: Confocal and STED microscopy. OLN-t40-α-syn cells were incubated with 40 μM LDN for 18 h (Co, untreated control). Cells were subjected to indirect immunofluorescence staining with antibodies against α-tubulin (A–D) and acetylated α-tubulin (E–H). Confocal images (one section: 0.21 μm) and STED images (one section: 0.13 μm) are shown. Scale bar confocal images (G): 20 μm. Scale bar STED images (H): 5 μm.
Figure 7
Effects of LDN treatment on microtubule detyrosination. (A,B) Indirect immunofluorescence staining: OLN-t40-α-syn cells were left untreated (A,a,B,a–c) or incubated with 40 μM LDN for 18 h (A,b,B,d–f). Cells were subjected to indirect immunofluorescence staining using antibodies against tyrosinated α-tubulin (tyr-tubulin; green) and detyrosinated tubulin (detyr-tubulin; red). Nuclei were stained with DAPI (blue). Scale bar: 20 μm. (C) Immunoblot analysis: OLN-t40-α-syn cells were incubated with 40 μM LDN for 18 h. Co, untreated control. Cell lysates were subjected to immunoblot analysis with the antibodies as indicated on the right. (D) Quantitative evaluation of the blot shown in (C) was carried out using ImageQuant software. Data represent the mean ± SD from three independent experiments. Tyr-tubulin and detyr-tubulin levels were normalized to α-tubulin and the total amount of the control was set to 100%. Statistical evaluation was carried out by Student’s _t_-test: *p < 0.05 significant.
Figure 8
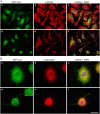
Inhibition of UCH-L1 leads to the formation of GFP positive autophagic vesicles. OLN-t40-α-syn-GFP-LC3 cells were incubated with 40 μM LDN for 18 h (d–f). Untreated control (a–c). (A) Cells were subjected to indirect immunofluorescence staining with an antibody against α-tubulin (red). GFP, green. Overlay with DAPI (blue). Scale bar: 20 μm. (B) Cells were subjected to indirect immunofluorescence staining with an antibody against α-syn (red). GFP, green. Overlay with DAPI (blue). The insert highlights the presence of GFP-positive autophagic vesicles after LDN treatment. Scale bar: 20 μm.
Figure 9
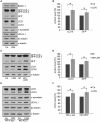
Inhibition of UCH-L1 in oligodendroglial cells induces autophagy. (A) OLN-t40-α-syn-GFP-LC3 cells were incubated with 40 μM LDN for 18 h (Co, untreated control). Cell lysates were subjected to immunoblot analysis with the antibodies as indicated on the right. (B) Quantitative evaluation of the blot shown in (A) was carried out using ImageQuant software. Data represent the mean ± SD from three independent experiments. LC3-II and GFP levels were normalized to α-tubulin and the total amount of the control was set to 100%. Statistical evaluation was carried out by Student’s _t_-test: *p < 0.05 significant. (C) OLN-t40-α-syn-GFP-LC3 cells were left untreated (Co), incubated with 40 μM LDN for 18 h, incubated with 3 nM bafilomycin A1 (Bf) for 20 h, or incubated with 3 nM Bf for 2 h followed by 40 μM LDN for 18 h. Cell lysates were subjected to immunoblot analysis with the antibodies as indicated on the right. (D) Quantitative evaluation of the blot shown in (C) was carried out as described above. LC3-II and GFP levels were normalized to α-tubulin and the total amount of the Bf treated cells were set to 100%. (E) OLN-t40-α-syn cells and OLN-t40-A53T cells were incubated with 40 μM LDN for 18 h (Co, untreated control). Cell lysates were subjected to immunoblot analysis with the antibodies as indicated on the right. (F) Quantitative evaluation of the blot shown in (E) was carried out as described above. LC3-II levels were normalized to α-tubulin and the total amount of the control was set to 100%.
Similar articles
- Autophagy mediates the clearance of oligodendroglial SNCA/alpha-synuclein and TPPP/p25A in multiple system atrophy models.
Mavroeidi P, Arvanitaki F, Vetsi M, Becker S, Vlachakis D, Jensen PH, Stefanis L, Xilouri M. Mavroeidi P, et al. Autophagy. 2022 Sep;18(9):2104-2133. doi: 10.1080/15548627.2021.2016256. Epub 2022 Jan 9. Autophagy. 2022. PMID: 35000546 Free PMC article. - Mitochondrial impairment and oxidative stress compromise autophagosomal degradation of α-synuclein in oligodendroglial cells.
Pukaß K, Goldbaum O, Richter-Landsberg C. Pukaß K, et al. J Neurochem. 2015 Oct;135(1):194-205. doi: 10.1111/jnc.13256. Epub 2015 Aug 12. J Neurochem. 2015. PMID: 26212128 - Inhibition of HDAC6 modifies tau inclusion body formation and impairs autophagic clearance.
Leyk J, Goldbaum O, Noack M, Richter-Landsberg C. Leyk J, et al. J Mol Neurosci. 2015 Apr;55(4):1031-46. doi: 10.1007/s12031-014-0460-y. Epub 2014 Dec 2. J Mol Neurosci. 2015. PMID: 25434725 - Familial Mutations and Post-translational Modifications of UCH-L1 in Parkinson's Disease and Neurodegenerative Disorders.
Lee YC, Hsu SD. Lee YC, et al. Curr Protein Pept Sci. 2017;18(7):733-745. doi: 10.2174/1389203717666160217143721. Curr Protein Pept Sci. 2017. PMID: 26899237 Review. - Protein aggregate formation in oligodendrocytes: tau and the cytoskeleton at the intersection of neuroprotection and neurodegeneration.
Richter-Landsberg C. Richter-Landsberg C. Biol Chem. 2016 Mar;397(3):185-94. doi: 10.1515/hsz-2015-0157. Biol Chem. 2016. PMID: 26083267 Review.
Cited by
- S-nitrosylation of UCHL1 induces its structural instability and promotes α-synuclein aggregation.
Kumar R, Jangir DK, Verma G, Shekhar S, Hanpude P, Kumar S, Kumari R, Singh N, Sarovar Bhavesh N, Ranjan Jana N, Kanti Maiti T. Kumar R, et al. Sci Rep. 2017 Mar 16;7:44558. doi: 10.1038/srep44558. Sci Rep. 2017. PMID: 28300150 Free PMC article. - Role of UCHL1 in axonal injury and functional recovery after cerebral ischemia.
Liu H, Povysheva N, Rose ME, Mi Z, Banton JS, Li W, Chen F, Reay DP, Barrionuevo G, Zhang F, Graham SH. Liu H, et al. Proc Natl Acad Sci U S A. 2019 Mar 5;116(10):4643-4650. doi: 10.1073/pnas.1821282116. Epub 2019 Feb 13. Proc Natl Acad Sci U S A. 2019. PMID: 30760601 Free PMC article. - The neuropathology of multiple system atrophy and its therapeutic implications.
Valera E, Masliah E. Valera E, et al. Auton Neurosci. 2018 May;211:1-6. doi: 10.1016/j.autneu.2017.11.002. Epub 2017 Nov 10. Auton Neurosci. 2018. PMID: 29169744 Free PMC article. Review. - Deconvoluting the complexity of autophagy and Parkinson's disease for potential therapeutic purpose.
Li J, Li S, Zhang L, Ouyang L, Liu B. Li J, et al. Oncotarget. 2015 Dec 1;6(38):40480-95. doi: 10.18632/oncotarget.5803. Oncotarget. 2015. PMID: 26415234 Free PMC article. Review. - Current understanding of the molecular mechanisms in Parkinson's disease: Targets for potential treatments.
Maiti P, Manna J, Dunbar GL. Maiti P, et al. Transl Neurodegener. 2017 Oct 25;6:28. doi: 10.1186/s40035-017-0099-z. eCollection 2017. Transl Neurodegener. 2017. PMID: 29090092 Free PMC article. Review.
References
LinkOut - more resources
Full Text Sources
Other Literature Sources
Research Materials
Miscellaneous
