Protein and Calorie Restriction Contribute Additively to Protection from Renal Ischemia Reperfusion Injury Partly via Leptin Reduction in Male Mice - PubMed (original) (raw)
. 2015 Aug;145(8):1717-27.
doi: 10.3945/jn.114.199380. Epub 2015 Jun 3.
J Humberto Treviño-Villarreal 1, Pedro Mejia 1, Yohann Grondin 2, Eylul Harputlugil 1, Christopher Hine 1, Dorathy Vargas 1, Hanqiao Zheng 1, C Keith Ozaki 3, Bruce S Kristal 4, Stephen J Simpson 5, James R Mitchell 6
Affiliations
- PMID: 26041674
- PMCID: PMC4516761
- DOI: 10.3945/jn.114.199380
Protein and Calorie Restriction Contribute Additively to Protection from Renal Ischemia Reperfusion Injury Partly via Leptin Reduction in Male Mice
Lauren T Robertson et al. J Nutr. 2015 Aug.
Abstract
Background: Short-term dietary restriction (DR) without malnutrition preconditions against surgical stress in rodents; however, the nutritional basis and underlying nutrient/energy-sensing pathways remain poorly understood.
Objectives: We investigated the relative contribution of protein restriction (PR) vs. calorie restriction (CR) to protection from renal ischemia reperfusion injury (IRI) and changes in organ-autonomous nutrient/energy-sensing pathways and hormones underlying beneficial effects.
Methods: Mice were preconditioned on experimental diets lacking total calories (0-50% CR) or protein/essential amino acids (EAAs) vs. complete diets consumed ad libitum (AL) for 1 wk before IRI. Renal outcome was assessed by serum markers and histology and integrated over a 2-dimensional protein/energy landscape by geometric framework analysis. Changes in renal nutrient/energy-sensing signal transduction and systemic hormones leptin and adiponectin were also measured. The genetic requirement for amino acid sensing via general control non-derepressible 2 (GCN2) was tested with knockout vs. control mice. The involvement of the hormone leptin was tested by injection of recombinant protein vs. vehicle during the preconditioning period.
Results: CR-mediated protection was dose dependent up to 50% with maximal 2-fold effect sizes. PR benefits were abrogated by EAA re-addition and additive with CR, with maximal benefits at any given amount of CR occurring with a protein-free diet. GCN2 was not required for functional benefits of PR. Activation and repression of nutrient/energy-sensing kinases, AMP-activated protein kinase (AMPK) and mechanistic target of rapamycin complex 1 (mTORC1), respectively, on PR reflected a state of negative energy balance, paralleled by 13% weight loss and an 87% decrease in leptin, independent of calorie intake. Recombinant leptin administration partially abrogated benefits of dietary preconditioning against renal IRI.
Conclusions: In male mice, PR and CR both contributed to the benefits of short-term DR against renal IRI independent of GCN2 but partially dependent on reduced circulating leptin and coincident with AMPK activation and mTORC1 repression.
Keywords: AMPK; GCN2; amino acid sensing; calorie restriction; dietary restriction; geometric framework; ischemia reperfusion injury; leptin; mTOR; protein restriction.
© 2015 American Society for Nutrition.
Conflict of interest statement
Author disclosures: LT Robertson, JH Treviño-Villarreal, P Mejia, Y Grondin, E Harputlugil, C Hine, D Vargas, H Zheng, CK Ozaki, BS Kristal, SJ Simpson, and JR Mitchell, no conflicts of interest.
Figures
FIGURE 1
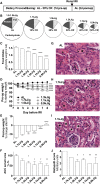
Dose-dependent effects of 1 wk of CR against bilateral renal IRI in male mice in experiment 1. (A) Schematic of preconditioning and postconditioning feeding regimens relative to the timing of surgical renal IRI induction (arrow). (B) Schematic of diets with pie slices proportional to the calorie content of the indicated macronutrient and circle areas proportional to the indicated level of daily energy intake. (C) Total food intake during the preconditioning period of the indicated groups; n = 2–3 cages/group. (D) Mouse weights during the preconditioning period are expressed as percentage of starting weight. (E) Postoperative weight on day 3 after IRI is expressed as a percentage of change after IRI. (F) Kidney function after renal IRI is expressed as a percentage of serum urea AUC of the AL group. (G–I) Representative hematoxylin and eosin–stained kidney sections from the indicated diet groups 3 d after injury. Arrows point to areas of tubular necrosis as evidenced by nuclear changes and cytoplasmic lysis or vacuolization. Arrowheads show tubular cast formation. Asterisks are positioned over tubules that show a normal structural characteristic. Scale bar = 50 μm. (J) Histopathology scores indicative of renal damage with 1 representing the least (0–25%) tubular damage and 4 representing the most (75–100%). Values are means ± SEMs; n = 8–13 mice/group. *,**,***,****Different from the AL diet group: *P < 0.05, **P < 0.01, ***P < 0.001, and ****P < 0.0001. AL, ad libitum; CR, calorie restriction; G, glomerulus; IRI, ischemia reperfusion injury; post-op, postoperative; pre-op, preoperative.
FIGURE 2
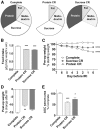
Effects of 1 wk of protein vs. carbohydrate restriction against renal IRI in male mice in experiment 2. (A) Schematic of complete or restricted diets that lack calories specifically from protein (protein CR) or sucrose (sucrose CR) with pie slices proportional to the calorie content of the indicated macronutrient. (B) Total food intake during the preconditioning period of the indicated groups, n = 2–3 cages/group. (C) Mouse weights during the preconditioning period are expressed as percentage of starting weight. (D) Postoperative weight on day 3 after IRI is expressed as a percentage change after IRI. (E) Kidney function after renal IRI is expressed as a percentage of serum urea AUC of the complete group. Values are means ± SEMs; n = 8–14 mice/group. *,**,***,****Different from complete control diet group: *P < 0.05, **P < 0.01, ***P < 0.001, and ****P < 0.0001. CR, calorie restriction; IRI, ischemia reperfusion injury; post-op, postoperative; pre-op, preoperative.
FIGURE 3
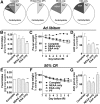
EAAs control benefits of 1 wk of PR against renal IRI in male mice in experiment 3. (A) Schematic of diets in which 18% of calories are contributed by protein (complete), sucrose (PF), NEAAs (NEAA only), or EEAs (EAA only); mice were preconditioned with these diets consumed AL (B–D) or restricted daily by ∼50% (E–G). (B, E) Daily food intake is expressed relative to mouse weight; n = 2 cages/group. (C, F) Mouse weights during the preconditioning period are expressed as percentage of starting weight. (D, G) Kidney function after renal IRI is expressed as a percentage of serum urea AUC of the complete diet group. Values are means ± SEMs; n = 4–5 mice/group. *,**,***,****Different from complete control diet group: *P < 0.05, **P < 0.01, ***P < 0.001, and ****P < 0.0001. AL, ad libitum; CR, calorie restriction; EAA, essential amino acid; IRI, ischemia reperfusion injury; NEAA, nonessential amino acid; PF, protein free; PR, protein restriction; pre-op, preoperative.
FIGURE 4
Effects of 1 wk of combined protein restriction and CR against renal IRI in male mice in experiment 4. (A) Total food intake is expressed relative to body weight with the indicated diet, with PF groups at the indicated daily energy intake and the AL complete diet group from Figure 1 as a reference; n = 2–3 cages/group. (B) Mouse weights during the preconditioning period are expressed as percentage of starting weight. (C) Postoperative weight on day 3 after IRI is expressed as a percentage of change after IRI. (D) Kidney function after renal IRI is expressed as a percentage of serum urea AUC of the AL complete diet group. Values are means ± SEMs; n = 9–13 mice/group. *,**,***,****Different from complete control diet group: *P < 0.05, **P < 0.01, ***P < 0.001, ****P < 0.0001. (E) Exponential fit of observed AUC serum urea data calculated as a percentage of the AL complete group in the corresponding experiment relative to total energy intake and expressed as percentage of calorie restriction. Observed AUC serum urea for the complete diet groups (circles) was best fitted by the equation AUC serum urea = 99 × exp(−0.0125 × CR) with strong positive Pearson’s correlation (r = 0.83, P < 0.001) between the observed and predicted data. The observed AUC serum urea for the PF diet groups (triangles) was best fitted by the equation AUC serum urea = 73 × exp(−0.0114 × CR), also with a strong Pearson’s correlation (r = 0.81, P = 0.029). (F) Geometric framework-based model of the nutritional basis of short-term dietary restriction. Axes represent daily energy intake of protein (x) or carbohydrates and fat (y). Colors indicate functional outcome of renal IRI as a percentage of dysfunction in mice that consumed a complete diet AL, with dark red indicating maximal dysfunction and dark blue maximal protection. Each dotted line represents a continuum of isocaloric diets that differ in macronutrient ratios; solid vertical lines represent diets with 0%, 18%, or 36% calories from protein as indicated. AL, ad libitum; Comp, complete diet; CR, calorie restriction; IRI, ischemia reperfusion injury; PF, protein free; post-op, postoperative; pre-op, preoperative; prot, protein.
FIGURE 5
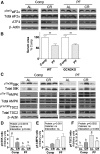
Protein- and energy-sensing signal transduction in kidney extracts from male mice after 1 wk of protein and/or CR in experiment 5. (A) Immunoblots of markers of GCN2 activation in kidney extracts from mice fed the indicated Comp or PF diet consumed AL or restricted ∼50% (CR). (B) Serum urea on day 1 after renal IRI of WT and GCN2 KO mice preconditioned with the indicated diet 1 wk before surgery in experiment 6; n = 5–9 mice/group. **Different from complete control within genotype, P < 0.01. (C) Immunoblots of mTORC1 target S6K, AMPK, and AMPK target TSC2 in kidney extracts from mice fed the indicated diets. (D–F) Quantitation of p/t ratios of S6K pThr389 (D), AMPK pThr172 (E), TSC2 pThr1387 (F); _n_ = 3–5 mice/group. Main effects of dietary protein (protein = Comp vs. PF), food restriction (calories = AL vs. CR), and interactions are indicated above each graph with _P_ values; ns, _P_ > 0.05. Means without a common letter differ, P < 0.05. Values are means ± SEMs. AL, ad libitum; AMPK, AMP-activated protein kinase; ATF4, activating transcription factor 4; Comp, complete diet; CR, calorie restriction; eIF2α, eukaryotic initiation factor 2α GCN2, general control non-derepressible 2; IRI, ischemia reperfusion injury; KO, knockout; PF, protein-free diet; p/t, phospho/total; S6K, p70 ribosomal S6 protein kinase; TSC2, tuberous sclerosis complex 2; WT, wild-type.
FIGURE 6
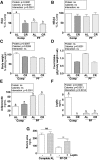
Metabolic and serum variables of male mice after 1 wk of protein and/or CR in experiment 5. (A, B) Combined means of individual serum EAAs (A) and NEAAs (B) calculated as a percentage of the AL complete diet group, after 1 wk fed the indicated diet. (C) Body weight is expressed as a percentage of the starting value. (D) Total food intake during the preconditioning period of the indicated groups; n = 2 cages/group. (E, F) Serum concentrations of adiponectin (E) and leptin (F) after 1 wk fed the indicated diet. Main effects of dietary protein (protein = complete vs. PF), food restriction (calories = AL vs. CR), and interactions are indicated above each graph with P values; ns, P > 0.05. Means without a common letter differ, P < 0.05; n = 5 mice/group. (G) Serum urea on day 1 after renal IRI of mice preconditioned with the indicated diet 1 wk before surgery and treated with leptin or vehicle in experiment 7 as indicated. **Different from vehicle control within diet, P < 0.01; n = 10–15 mice/group. Values are means ± SEMs. AL, ad libitum; Comp, complete diet; CR, ∼50% calorie restriction; EAA, essential amino acids; IRI, ischemia reperfusion injury; KO, knockout; NEAA, nonessential amino acids; PF, protein-free diet; WT, wild-type.
Similar articles
- Effects of timing of food intake and fat/carbohydrate ratio on insulin sensitivity and preconditioning against renal ischemia reperfusion injury by calorie restriction.
Reynolds JS, Peng W, Chu T, Mitchell JR. Reynolds JS, et al. Nutr Healthy Aging. 2019 Apr 2;5(1):23-32. doi: 10.3233/NHA-180044. Nutr Healthy Aging. 2019. PMID: 31093582 Free PMC article. - The TSC complex is required for the benefits of dietary protein restriction on stress resistance in vivo.
Harputlugil E, Hine C, Vargas D, Robertson L, Manning BD, Mitchell JR. Harputlugil E, et al. Cell Rep. 2014 Aug 21;8(4):1160-70. doi: 10.1016/j.celrep.2014.07.018. Epub 2014 Aug 14. Cell Rep. 2014. PMID: 25131199 Free PMC article. - Surgical stress resistance induced by single amino acid deprivation requires Gcn2 in mice.
Peng W, Robertson L, Gallinetti J, Mejia P, Vose S, Charlip A, Chu T, Mitchell JR. Peng W, et al. Sci Transl Med. 2012 Jan 25;4(118):118ra11. doi: 10.1126/scitranslmed.3002629. Sci Transl Med. 2012. PMID: 22277968 Free PMC article. - Amino acid sensing in dietary-restriction-mediated longevity: roles of signal-transducing kinases GCN2 and TOR.
Gallinetti J, Harputlugil E, Mitchell JR. Gallinetti J, et al. Biochem J. 2013 Jan 1;449(1):1-10. doi: 10.1042/BJ20121098. Biochem J. 2013. PMID: 23216249 Free PMC article. Review. - Calories or protein? The effect of dietary restriction on lifespan in rodents is explained by calories alone.
Speakman JR, Mitchell SE, Mazidi M. Speakman JR, et al. Exp Gerontol. 2016 Dec 15;86:28-38. doi: 10.1016/j.exger.2016.03.011. Epub 2016 Mar 19. Exp Gerontol. 2016. PMID: 27006163 Review.
Cited by
- The kidney: the critical organ system for guiding nutrition therapy in the ICU-patient?
Druml W, Staudinger T, Joannidis M. Druml W, et al. Crit Care. 2024 Aug 7;28(1):266. doi: 10.1186/s13054-024-05052-5. Crit Care. 2024. PMID: 39113139 Free PMC article. Review. - Protein Restriction, Epigenetic Diet, Intermittent Fasting as New Approaches for Preventing Age-associated Diseases.
Hanjani NA, Vafa M. Hanjani NA, et al. Int J Prev Med. 2018 Jun 29;9:58. doi: 10.4103/ijpvm.IJPVM_397_16. eCollection 2018. Int J Prev Med. 2018. PMID: 30050669 Free PMC article. Review. - Preoperative methionine restriction induces perivascular adipose tissue browning and improves vein graft remodeling in male mice.
Kip P, Sluiter TJ, MacArthur MR, Tao M, Kruit N, Mitchell SJ, Jung J, Kooijman S, Gorham J, Seidman JG, Quax PHA, Decano JL, Aikawa M, Ozaki CK, Mitchell JR, de Vries MR. Kip P, et al. Nat Commun. 2024 Nov 7;15(1):9652. doi: 10.1038/s41467-024-53844-8. Nat Commun. 2024. PMID: 39511181 Free PMC article. - Restricting a single amino acid cross-protects Drosophila melanogaster from nicotine poisoning through mTORC1 and GCN2 signalling.
Fulton TL, Mirth CK, Piper MDW. Fulton TL, et al. Open Biol. 2022 Dec;12(12):220319. doi: 10.1098/rsob.220319. Epub 2022 Dec 14. Open Biol. 2022. PMID: 36514979 Free PMC article. - Dietary protein restriction reduces circulating VLDL triglyceride levels via CREBH-APOA5-dependent and -independent mechanisms.
Treviño-Villarreal JH, Reynolds JS, Bartelt A, Langston PK, MacArthur MR, Arduini A, Tosti V, Veronese N, Bertozzi B, Brace LE, Mejia P, Trocha K, Kajitani GS, Longchamp A, Harputlugil E, Gathungu R, Bird SS, Bullock AD, Figenshau RS, Andriole GL, Thompson A, Heeren J, Ozaki CK, Kristal BS, Fontana L, Mitchell JR. Treviño-Villarreal JH, et al. JCI Insight. 2018 Nov 2;3(21):e99470. doi: 10.1172/jci.insight.99470. JCI Insight. 2018. PMID: 30385734 Free PMC article. Clinical Trial.
References
- Speakman JR, Mitchell SE. Caloric restriction. Mol Aspects Med 2011;32:159–221. - PubMed
- Masoro EJ. Subfield history: caloric restriction, slowing aging, and extending life. Sci Aging Knowledge Environ 2003;2003:RE2. - PubMed
- Heilbronn LK, de Jonge L, Frisard MI, DeLany JP, Larson-Meyer DE, Rood J, Nguyen T, Martin CK, Volaufova J, Most MM, et al. . Effect of 6-month calorie restriction on biomarkers of longevity, metabolic adaptation, and oxidative stress in overweight individuals: a randomized controlled trial. JAMA 2006;295:1539–48. - PMC - PubMed
Publication types
MeSH terms
Substances
Grants and funding
- R01 DK090629/DK/NIDDK NIH HHS/United States
- DK090629/DK/NIDDK NIH HHS/United States
- T32 DK007260/DK/NIDDK NIH HHS/United States
- T32 ES016645/ES/NIEHS NIH HHS/United States
- R01 AG036712/AG/NIA NIH HHS/United States
- AG036712/AG/NIA NIH HHS/United States
- 5T32CA00938230/CA/NCI NIH HHS/United States
LinkOut - more resources
Full Text Sources
Other Literature Sources
Medical
Research Materials
Miscellaneous
