Redox-dependent Ligand Switching in a Sensory Heme-binding GAF Domain of the Cyanobacterium Nostoc sp. PCC7120 - PubMed (original) (raw)
Redox-dependent Ligand Switching in a Sensory Heme-binding GAF Domain of the Cyanobacterium Nostoc sp. PCC7120
Kun Tang et al. J Biol Chem. 2015.
Abstract
The genome of the cyanobacterium Nostoc sp. PCC7120 carries three genes (all4978, all7016, and alr7522) encoding putative heme-binding GAF (cGMP-specific phosphodiesterases, adenylyl cyclases, and FhlA) proteins that were annotated as transcriptional regulators. They are composed of an N-terminal cofactor domain and a C-terminal helix-turn-helix motif. All4978 showed the highest affinity for protoheme binding. The heme binding capability of All7016 was moderate, and Alr7522 did not bind heme at all. The "as isolated" form of All4978, identified by Soret band (λmax = 427 nm), was assigned by electronic absorption, EPR, and resonance Raman spectroscopy as a hexa-coordinated low spin Fe(III) heme with a distal cysteine ligand (absorption of δ-band around 360 nm). The protoheme cofactor is noncovalently incorporated. Reduction of the heme could be accomplished by chemically using sodium dithionite and electrospectrochemically; this latter method yielded remarkably low midpoint potentials of -445 and -453 mV (following Soret and α-band absorption changes, respectively). The reduced form of the heme (Fe(II) state) binds both NO and CO. Cysteine coordination of the as isolated Fe(III) protein is unambiguous, but interestingly, the reduced heme instead displays spectral features indicative of histidine coordination. Cys-His ligand switches have been reported as putative signaling mechanisms in other heme-binding proteins; however, these novel cyanobacterial proteins are the first where such a ligand-switch mechanism has been observed in a GAF domain. DNA binding of the helix-turn-helix domain was investigated using a DNA sequence motif from its own promoter region. Formation of a protein-DNA complex preferentially formed in ferric state of the protein.
Keywords: GAF domain; Raman spectroscopy; cyanobacteria; electron paramagnetic resonance (EPR); heme; ligand-binding protein; protein conformation; protein folding; signaling.
© 2015 by The American Society for Biochemistry and Molecular Biology, Inc.
Figures
FIGURE 1.
A, amino acid sequence alignment between GAF domains: GAFAll4978, GAFAll7016, GAFAlr7522, and GAFDosS. Secondary structure elements were derived from the x-ray structure of GAFDosS (PDB code 2W3G). The proximal heme ligand His-149 of GAFDosS and the potential proximal heme ligands for GAFAll4978, Cys-92 and His-95, are shown by stars. B, amino acid sequence alignment between helix-turn-helix motifs: HtHAll4978, HtHAll7016, HtHAlr7522, and HtHNarL. Secondary structure elements were derived from the x-ray structure of HtHNarL (PDB code 1JE8). The C-terminally HtH domain of All4978 is highly similar to NarL of E. coli (PDB code 1JE8), nitrate reductase, an important enzyme to nitrogen metabolism. In NarL, the regulation proceeds via phosphorylation of a Rec domain (N-terminal, aa 10–124), followed by structural changes of the C-terminal HtH domain. Multiple alignment was done using the T-coffee software and visualized using ESPript.
FIGURE 2.
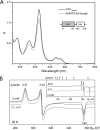
A, absorbance spectra and domain structure of as isolated heme-binding full-length All4978 and the separated GAF domain (GAFAll4978) from Nostoc sp. PCC 7120. B, corresponding low temperature X-band EPR spectra (9.65 GHz) of the as isolated GAFAll4978 collected for two microwave power (MP) values, 2 milliwatts (black) and 0.2 milliwatts (gray). The data traces were scaled to account for the difference in MP, i.e. multiplied by √MP. The dashed line shows a spin Hamiltonian simulation consistent with a low spin (S = ½) FeIII ferriheme signal. The inset shows that the ferriheme signal displays the same line shape over a large temperature range and demonstrated that the protein does not display any other EPR active species, e.g. high spin heme signals.
FIGURE 3.
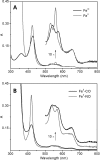
Absorption spectra of different ligation states of GAFAll4978. A, ferric form, as isolated (black), and ferrous form upon reduction (gray). B, CO-bound (black) and NO-bound (gray) upon reduction.
FIGURE 4.
Spectroelectrochemical titration of GAFAll4978, beginning at −545 mV. Both the 424- and 559-nm bands reveal a remarkably low reduction potential _E_0 of −445 ± 2 and −453 ± 2 mV, respectively.
FIGURE 5.
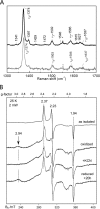
A, RR spectrum (high frequency region) of (top) ferric GAFAll4978 as isolated. Bottom, ferric GAFAll4978 after reduction and re-oxidation (20 m
m
KPi at 77 K; λex = 406.7 nm). B, EPR spectra of GAFAll4978 in as isolated (top trace), K6Fe(CN)3-oxidized form (2nd trace), cyanide-bound form (3rd trace), and reduced form exposed to air for 20 h (bottom trace).
FIGURE 6.
MCD spectra of GAFAll4978 recorded at room temperature (B = 1.4 tesla) in 20 mm KPi. The spectrum of the as isolated form is given as a dotted line. The ferrous form (gray) was generated in a nitrogen atmosphere upon addition of 2 m
m
Na2S2O4. The carbonyl liganded sample (black) was prepared in a CO atmosphere upon addition of 2 m
m
Na2S2O4.
FIGURE 7.
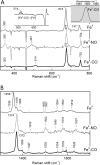
RR spectroscopy (λex = 406.7 nm) of frozen samples (77 K) of ferroheme GAFAll4978 in 20 mm KPi without ligand (5c, gray, in bold) and with NO (black, thin line) and CO (black, in bold) as sixth ligand. A, low frequency part. Top, difference spectrum (black) between GAFAll4978 [FeII] and GAFAll4978 [FeII-CO] is displayed to identify νFe-CO. The resulting band at 514 cm−1 was fitted with a single Voigt function (gray inset). The inset shows the C=O band in the FTIR spectrum of the sample recorded at 25 °C. B, high frequency part.
FIGURE 8.
Anticorrelation plot of νC-O_versus_ νFe-CO. It was previously demonstrated (53) that the CO complexes of ferrohemes fall into four groups as follows: (i) Cys-coordinated cytochrome P450 type (gray dashed line); (ii) the Cys-coordinated nitric-oxide synthases type (NOS, gray solid line) (70, 71); (iii) His-coordinated protein heme and imidazole-synthetic heme models (black dashed line) (72); and (iv) 5-coordinate hemes (black solid line, mainly model compounds) (73). Proteins are displayed as filled symbols and model compounds as open symbols. The heme sensor proteins DosS (69), Rev-erbβ (54), CooA (67, 74), _Ec_DOS (75), and GAFAll4978 (this work) are displayed as stars. The abbreviations used are as follows: CcP, cytochrome c peroxidase; ClBz, chlorobenzene; CooA, CO-sensing transcription factor from Rhodospirillum rubrum; CPO, chloroperoxidase; DosS, GAF A domain of the histidine kinase DosS from M. tuberculosis; EcDOS, heme-regulated phosphodiesterase from E. coli; _HbM_α, hemoglobin M Boston-α; HRP, horseradish peroxidase; P450, cytochrome P450cam; _Rev-erb_β, human transcription factor; TpivP, picket fence porphyrin.
FIGURE 9.
A, comparison of the homology model of GAFAll4978(17–149) with His-95 as proximal heme ligand (orange) and with the x-ray structure of GAFDosS (PDB code 2W3G) (15) (purple). B, comparison of the heme pocket of the homology model of GAFAll4978 with His-95 (blue ribbons) or Cys-92 (yellow) as proximal heme ligand. Figures were prepared with Swiss-PdbViewer 4.1(28) and rendered with POV-Ray 3.6.
FIGURE 10.
EMSA of All4978 with promoter DNA. A, the upstream sequence of All4978 was analyzed by the BPROM program. The putative −10 and −35 regions of the promoter are shown in bold and boxed. The position of the transcriptional start site is indicated by an arrow. The start codon (ATG) of All4978 is shown in bold. The nucleotide sequence underlined was synthesized for the binding assay. B, EMSA of All4978 in ferric state. C, EMSA of All4978 in ferrous state. Protein concentrations were 20, 5, 2, 1, 0.5, and 0 μ
m
. Concentration of digoxigenin-labeled DNA in all experiments was 15 n
m
.
Similar articles
- Investigation of the role of the N-terminal proline, the distal heme ligand in the CO sensor CooA.
Clark RW, Youn H, Parks RB, Cherney MM, Roberts GP, Burstyn JN. Clark RW, et al. Biochemistry. 2004 Nov 9;43(44):14149-60. doi: 10.1021/bi0487948. Biochemistry. 2004. PMID: 15518565 - The transcription regulator RcoM-2 from Burkholderia xenovorans is a cysteine-ligated hemoprotein that undergoes a redox-mediated ligand switch.
Marvin KA, Kerby RL, Youn H, Roberts GP, Burstyn JN. Marvin KA, et al. Biochemistry. 2008 Aug 26;47(34):9016-28. doi: 10.1021/bi800486x. Epub 2008 Aug 2. Biochemistry. 2008. PMID: 18672900 Free PMC article. - Identification of Cys94 as the distal ligand to the Fe(III) heme in the transcriptional regulator RcoM-2 from Burkholderia xenovorans.
Smith AT, Marvin KA, Freeman KM, Kerby RL, Roberts GP, Burstyn JN. Smith AT, et al. J Biol Inorg Chem. 2012 Oct;17(7):1071-82. doi: 10.1007/s00775-012-0920-1. Epub 2012 Aug 2. J Biol Inorg Chem. 2012. PMID: 22855237 Free PMC article. - Nitric oxide interaction with insect nitrophorins and thoughts on the electron configuration of the {FeNO}6 complex.
Walker FA. Walker FA. J Inorg Biochem. 2005 Jan;99(1):216-36. doi: 10.1016/j.jinorgbio.2004.10.009. J Inorg Biochem. 2005. PMID: 15598503 Review. - Regulation of protein function and degradation by heme, heme responsive motifs, and CO.
Fleischhacker AS, Sarkar A, Liu L, Ragsdale SW. Fleischhacker AS, et al. Crit Rev Biochem Mol Biol. 2022 Feb;57(1):16-47. doi: 10.1080/10409238.2021.1961674. Epub 2021 Sep 13. Crit Rev Biochem Mol Biol. 2022. PMID: 34517731 Free PMC article. Review.
Cited by
- The PolS-PolR Two-Component System Regulates Genes Involved in Poly-P Metabolism and Phosphate Transport in Microlunatus phosphovorus.
Zhong C, Zhang P, Liu C, Liu M, Chen W, Fu J, Qi X, Cao G. Zhong C, et al. Front Microbiol. 2019 Sep 13;10:2127. doi: 10.3389/fmicb.2019.02127. eCollection 2019. Front Microbiol. 2019. PMID: 31572333 Free PMC article. - Second messengers and divergent HD-GYP phosphodiesterases regulate 3',3'-cGAMP signaling.
Wright TA, Jiang L, Park JJ, Anderson WA, Chen G, Hallberg ZF, Nan B, Hammond MC. Wright TA, et al. Mol Microbiol. 2020 Jan;113(1):222-236. doi: 10.1111/mmi.14412. Epub 2019 Nov 17. Mol Microbiol. 2020. PMID: 31665539 Free PMC article.
References
- Gilles-Gonzalez M. A., Gonzalez G. (2005) Heme-based sensors: defining characteristics, recent developments, and regulatory hypotheses. J. Inorg. Biochem. 99, 1–22 - PubMed
- Dawson J. H., Sono M. (1987) Cytochrome P-450 and chloroperoxidase: thiolate-ligated heme enzymes. Spectroscopic determination of their active site structures and mechanistic implications of thiolate ligation. Chem. Rev. 87, 1255–1276
Publication types
MeSH terms
Substances
LinkOut - more resources
Full Text Sources


