Arginine-Ornithine Antiporter ArcD Controls Arginine Metabolism and Interspecies Biofilm Development of Streptococcus gordonii - PubMed (original) (raw)
Arginine-Ornithine Antiporter ArcD Controls Arginine Metabolism and Interspecies Biofilm Development of Streptococcus gordonii
Akito Sakanaka et al. J Biol Chem. 2015.
Abstract
Arginine is utilized by the oral inhabitant Streptococcus gordonii as a substrate of the arginine deiminase system (ADS), eventually producing ATP and NH3, the latter of which is responsible for microbial resistance to pH stress. S. gordonii expresses a putative arginine-ornithine antiporter (ArcD) whose function has not been investigated despite relevance to the ADS and potential influence on inter-bacterial communication with periodontal pathogens that utilize amino acids as a main energy source. Here, we generated an S. gordonii ΔarcD mutant to explore the role of ArcD in physiological homeostasis and bacterial cross-feeding. First, we confirmed that S. gordonii ArcD plays crucial roles for mediating arginine uptake and promoting bacterial growth, particularly under arginine-limited conditions. Next, metabolomic profiling and transcriptional analysis of the ΔarcD mutant revealed that deletion of this gene caused intracellular accumulation of ornithine leading to malfunction of the ADS and suppression of de novo arginine biosynthesis. The mutant strain also showed increased susceptibility to low pH stress due to reduced production of ammonia. Finally, accumulation of Fusobacterium nucleatum was found to be significantly decreased in biofilm formed by the ΔarcD mutant as compared with the wild-type strain, although ornithine supplementation restored fusobacterium biovolume in dual-species biofilms with the ΔarcD mutant and also enhanced single species biofilm development by F. nucleatum. Our results are the first direct evidence showing that S. gordonii ArcD modulates not only alkali and energy production but also interspecies interaction with F. nucleatum, thus initiating a middle stage of periodontopathic biofilm formation, by metabolic cross-feeding.
Keywords: Fusobacterium; Streptococcus; arginine metabolism; biofilm; cell metabolism; cross-feeding; metabolic regulation; metabolomics; ornithine export; symbiosis.
© 2015 by The American Society for Biochemistry and Molecular Biology, Inc.
Figures
FIGURE 1.
Arginine uptake activity by ArcD of S. gordonii. A, time course of radiolabeled arginine uptake by S. gordonii WT and its derivatives. The reaction was started by adding radiolabeled arginine to a final concentration of 50 μ
m
. Data are shown as the mean ± S.E. of triplicate experiments. B, dose dependence of arginine uptake by S. gordonii WT and its derivatives after 1 min. Data are shown as the mean ± S.E. of triplicate experiments. C, kinetic parameters of arginine uptake by S. gordonii WT and its derivatives. Km and _V_max values were calculated based on a Michaelis-Menten saturation curve with a nonlinear curve fit using ORIGIN 2015. D, effects of unlabeled arginine analogues and control amino acids on arginine uptake by S. gordonii WT after 20 s. The rate of arginine uptake was measured in the presence of candidate substrates added at 100-fold excess over radiolabeled arginine (50 μ
m
). Data are shown as the mean ± S.E. of triplicate experiments. *, p < 0.05; **, p < 0.01 (versus control).
FIGURE 2.
Bacterial growth and shifts in extracellular concentrations of arginine, ornithine, and citrulline. A, growth of S. gordonii WT and its derivatives in CDM containing 1 m
m
arginine and 1.2% glucose. Data are shown as the mean ± S.D. of triplicate experiments and are analyzed by repeated measures analysis of variance; *, p < 0.01 (versus WT or Comp arcD). B, arginine uptake and ornithine export by the tested strains. Shifts in the extracellular concentration of arginine and its related metabolites in culture supernatants were examined after 0 and 6 h of incubation. Data are shown as the mean ± S.E. of triplicate experiments. *, p < 0.01. C, growth of S. gordonii WT and Δ_arcD_ in CDM containing various concentrations of arginine. Data are shown as the mean ± S.D. of triplicate experiments and analyzed by repeated measures analysis of variance. *, p < 0.01 (versus WT with 2 m
m
arginine). D, growth of S. gordonii WT and Δ_arcD_ in CDM containing various concentrations of arginine after 6 h of incubation. Data are shown as the mean ± S.D. of triplicate experiments. *, p < 0.01 (versus WT at corresponding concentration).
FIGURE 3.
Principal component analysis of intracellular metabolome of WT and Δ_arcD_. Score plots for PC1 and PC2 are shown. Blue and red circles represent WT and Δ_arcD_, respectively.
FIGURE 4.
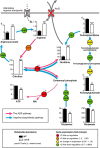
Perturbed ornithine cycle in Δ_arcD_. A schematic illustration of the metabolite abundance of S. gordonii involved in the ornithine cycle in combination with related transcriptional changes shown in the results of RT-PCR experiments is presented. Metabolites and transcripts were extracted following 8 h of incubation in CDM containing 1 m
m
arginine and 0.1 m
m
galactose at pH 7.0, followed by determination of those levels using CE-TOF-MS and real time RT-PCR, respectively. To minimize the influence of growth stage differences, cultures were started at an _A_600 value of 0.8. Bars represent the mean ± S.D. (n = 3). *, p < 0.05; **, p < 0.01; ***, p < 0.001; †, relative level of metabolite abundance.
FIGURE 5.
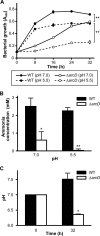
Growth impairment of Δ_arcD_ associated with reduced production of ammonia in both neutral and acidic environments. A, growth of S. gordonii WT and arcD mutant in CDM containing 1 m
m
arginine and 0.1% galactose with pH values adjusted to 7.0 and 5.5. Data shown are representative of three individual experiments performed in triplicate and presented as the mean ± S.D. with analysis by repeated measures analysis of variance; **, p < 0.01. B, changes in amount of ammonia in medium following 32 h of incubation. Data are presented as the mean ± S.E. of a representative experiment performed in triplicate; *, p < 0.05; **, p < 0.01. C, medium pH following 32 h of incubation after initial adjustment to 7.0. Data are presented as the mean ± S.E. of a representative experiment performed in triplicate; *, p < 0.05.
FIGURE 6.
Quantification of F. nucleatum accumulation in biofilms formed by various S. gordonii strains. A, representative CLSM images showing typical architecture of biofilms following reconstruction by Imaris software. S. gordonii cells were stained with hexidium iodide (red), and biofilms were formed in the bottom chambers after 16 h of incubation, then gently washed with PBS, and co-cultured for 24 h with FITC-labeled F. nucleatum (green) suspended in PBS. B, biovolume of F. nucleatum after 24 h of co-incubation. Data shown are representative of three individual experiments and are presented as the mean ± S.E.; **, p < 0.01.
FIGURE 7.
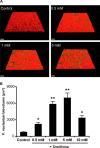
Effect of ornithine supplementation on F. nucleatum accumulation in biofilms formed in co-cultures with S. gordonii Δ_arcD_. A, representative images of typical biofilm architecture. S. gordonii (red), F. nucleatum (green) dual-species biofilms were formed in the presence of various concentrations of ornithine after 24 h of co-incubation. B, biovolume of F. nucleatum after 24 h of co-incubation. Data shown are representative of three individual experiments and presented as the mean ± S.E.; *, p < 0.05; **, p < 0.01.
FIGURE 8.
Effect of ornithine supplementation on mono-species biofilm formation by F. nucleatum. A, representative images of typical biofilm architecture. Cells were stained with FITC (green), and mono-species biofilms were formed in the presence of various concentrations of ornithine after 24 h of incubation. B, biovolume of F. nucleatum after 24 h of incubation. Data shown are representative of three individual experiments and presented as the mean ± S.E.; **, p < 0.01. Images were acquired by CLSM and reconstructed by Imaris software. C, planktonic growth of F. nucleatum in the presence of various concentrations of ornithine. Data are shown as the mean ± S.D. of triplicate experiments.
FIGURE 9.
Quantification of P. gingivalis accumulation in biofilms formed by S. gordonii strains. A, representative images of typical biofilm architecture. S. gordonii biofilms (red) were formed after 16 h of incubation, then gently washed with PBS, and co-cultured for 24 h with FITC-labeled P. gingivalis (green) suspended in PBS. B, biovolume of P. gingivalis after 24 h of co-incubation. Data shown are representative of three individual experiments and presented as the mean ± S.E.
Similar articles
- Fusobacterium nucleatum Metabolically Integrates Commensals and Pathogens in Oral Biofilms.
Sakanaka A, Kuboniwa M, Shimma S, Alghamdi SA, Mayumi S, Lamont RJ, Fukusaki E, Amano A. Sakanaka A, et al. mSystems. 2022 Aug 30;7(4):e0017022. doi: 10.1128/msystems.00170-22. Epub 2022 Jul 19. mSystems. 2022. PMID: 35852319 Free PMC article. - The arginine-ornithine antiporter ArcD contributes to biological fitness of Streptococcus suis.
Fulde M, Willenborg J, Huber C, Hitzmann A, Willms D, Seitz M, Eisenreich W, Valentin-Weigand P, Goethe R. Fulde M, et al. Front Cell Infect Microbiol. 2014 Aug 12;4:107. doi: 10.3389/fcimb.2014.00107. eCollection 2014. Front Cell Infect Microbiol. 2014. PMID: 25161959 Free PMC article. - Interspecies metabolite transfer fuels the methionine metabolism of Fusobacterium nucleatum to stimulate volatile methyl mercaptan production.
Hara T, Sakanaka A, Lamont RJ, Amano A, Kuboniwa M. Hara T, et al. mSystems. 2024 Feb 20;9(2):e0076423. doi: 10.1128/msystems.00764-23. Epub 2024 Jan 30. mSystems. 2024. PMID: 38289043 Free PMC article. - Mixed oral biofilms are controlled by the interspecies interactions of Fusobacterium nucleatum.
Valadbeigi H, Khoshnood S, Negahdari B, Maleki A, Mohammadinejat M, Haddadi MH. Valadbeigi H, et al. Oral Dis. 2024 Sep;30(6):3582-3590. doi: 10.1111/odi.14822. Epub 2023 Nov 27. Oral Dis. 2024. PMID: 38009960 Review. - Streptococcus gordonii finger infection: Case report and a review of the literature.
Kang CW, Pu XB, Tan G, Dong CC, Yan ZK, Wu LX. Kang CW, et al. Medicine (Baltimore). 2022 Dec 23;101(51):e32506. doi: 10.1097/MD.0000000000032506. Medicine (Baltimore). 2022. PMID: 36595860 Free PMC article. Review.
Cited by
- [Salivary Metabolic Profiling in Patients with Periodontitis].
Chen J, Du Y, Zhou XD, Zhang P. Chen J, et al. Sichuan Da Xue Xue Bao Yi Xue Ban. 2022 Sep;53(5):842-850. doi: 10.12182/20220960207. Sichuan Da Xue Xue Bao Yi Xue Ban. 2022. PMID: 36224687 Free PMC article. Chinese. - Moving beyond descriptive studies: harnessing metabolomics to elucidate the molecular mechanisms underpinning host-microbiome phenotypes.
Bishop SL, Drikic M, Wacker S, Chen YY, Kozyrskyj AL, Lewis IA. Bishop SL, et al. Mucosal Immunol. 2022 Jun;15(6):1071-1084. doi: 10.1038/s41385-022-00553-4. Epub 2022 Aug 15. Mucosal Immunol. 2022. PMID: 35970917 Review. - Proteomic and Metabolomic Analyses Provide Insights into the Mechanism on Arginine Metabolism Regulated by tRNA Modification Enzymes GidA and MnmE of Streptococcus suis.
Gao T, Yuan F, Liu Z, Liu W, Zhou D, Yang K, Guo R, Liang W, Zou G, Zhou R, Tian Y. Gao T, et al. Front Cell Infect Microbiol. 2020 Dec 11;10:597408. doi: 10.3389/fcimb.2020.597408. eCollection 2020. Front Cell Infect Microbiol. 2020. PMID: 33425782 Free PMC article. - Acquired resistance to innate immune clearance promotes Klebsiella pneumoniae ST258 pulmonary infection.
Ahn D, Peñaloza H, Wang Z, Wickersham M, Parker D, Patel P, Koller A, Chen EI, Bueno SM, Uhlemann AC, Prince A. Ahn D, et al. JCI Insight. 2016 Oct 20;1(17):e89704. doi: 10.1172/jci.insight.89704. JCI Insight. 2016. PMID: 27777978 Free PMC article. - Porphyromonas gingivalis adopts intricate and unique molecular mechanisms to survive and persist within the host: a critical update.
Chopra A, Bhat SG, Sivaraman K. Chopra A, et al. J Oral Microbiol. 2020 Aug 3;12(1):1801090. doi: 10.1080/20002297.2020.1801090. J Oral Microbiol. 2020. PMID: 32944155 Free PMC article. Review.
References
- Pihlstrom B. L., Michalowicz B. S., Johnson N. W. (2005) Periodontal diseases. Lancet 366, 1809–1820 - PubMed
- Kolenbrander P. E., Palmer R. J., Jr., Periasamy S., Jakubovics N. S. (2010) Oral multispecies biofilm development and the key role of cell-cell distance. Nat. Rev. Microbiol. 8, 471–480 - PubMed
Publication types
MeSH terms
Substances
LinkOut - more resources
Full Text Sources
Other Literature Sources
Medical
Molecular Biology Databases


