Anticancer drug sensitivity prediction in cell lines from baseline gene expression through recursive feature selection - PubMed (original) (raw)
Anticancer drug sensitivity prediction in cell lines from baseline gene expression through recursive feature selection
Zuoli Dong et al. BMC Cancer. 2015.
Abstract
Background: An enduring challenge in personalized medicine is to select right drug for individual patients. Testing drugs on patients in large clinical trials is one way to assess their efficacy and toxicity, but it is impractical to test hundreds of drugs currently under development. Therefore the preclinical prediction model is highly expected as it enables prediction of drug response to hundreds of cell lines in parallel.
Methods: Recently, two large-scale pharmacogenomic studies screened multiple anticancer drugs on over 1000 cell lines in an effort to elucidate the response mechanism of anticancer drugs. To this aim, we here used gene expression features and drug sensitivity data in Cancer Cell Line Encyclopedia (CCLE) to build a predictor based on Support Vector Machine (SVM) and a recursive feature selection tool. Robustness of our model was validated by cross-validation and an independent dataset, the Cancer Genome Project (CGP).
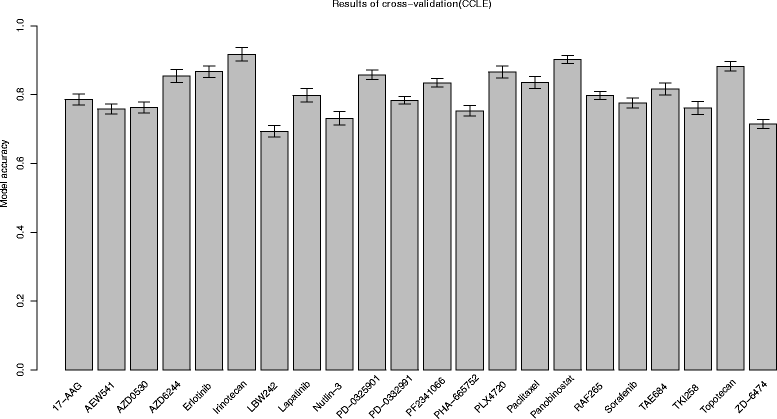
Results: Our model achieved good cross validation performance for most drugs in the Cancer Cell Line Encyclopedia (≥80% accuracy for 10 drugs, ≥75% accuracy for 19 drugs). Independent tests on eleven common drugs between CCLE and CGP achieved satisfactory performance for three of them, i.e., AZD6244, Erlotinib and PD-0325901, using expression levels of only twelve, six and seven genes, respectively.
Conclusions: These results suggest that drug response could be effectively predicted from genomic features. Our model could be applied to predict drug response for some certain drugs and potentially play a complementary role in personalized medicine.
Figures
Fig. 1
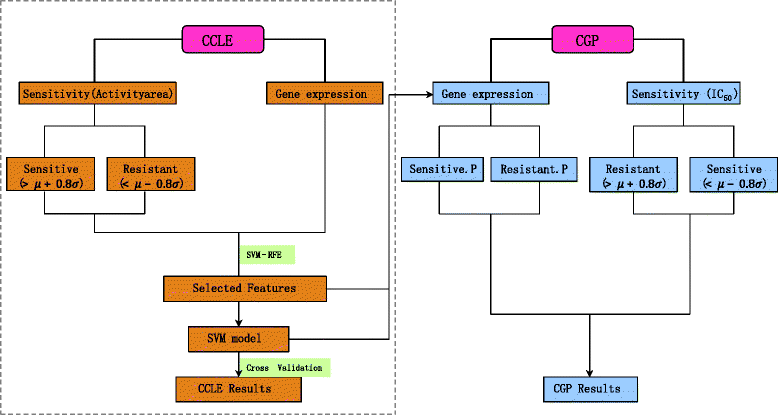
Computational framework. In the left panel, cell lines in CCLE were first divided into three groups according to their normalized drug response values. Then gene expression features were selected by SVM-RFE for building an SVM model, where the optimal feature number and parameters were obtained by a 10-fold cross validation. To test the generalization ability of the model, in the right panel, gene expression profile of CGP data set was fed to the model to get the attribute (sensitive or resistant) of each cell line. Then CGP performance was measured by comparing the model prediction with the sample classification based on the normalized IC50
Fig. 2
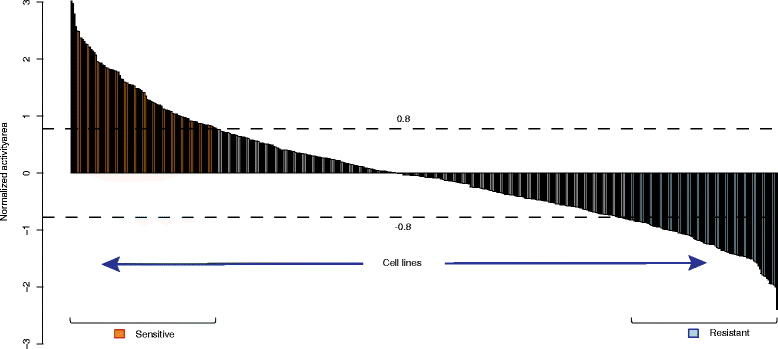
Sample classification for the drug Panobinostat. All samples are classified into three groups according to the threshold 0.8 SDs of the normalized activity area
Fig. 3
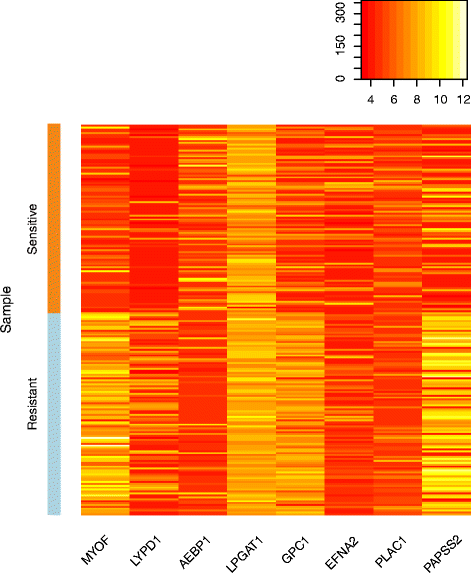
Gene expression of sensitive and resistant cell lines for Panobinostat
Fig. 4
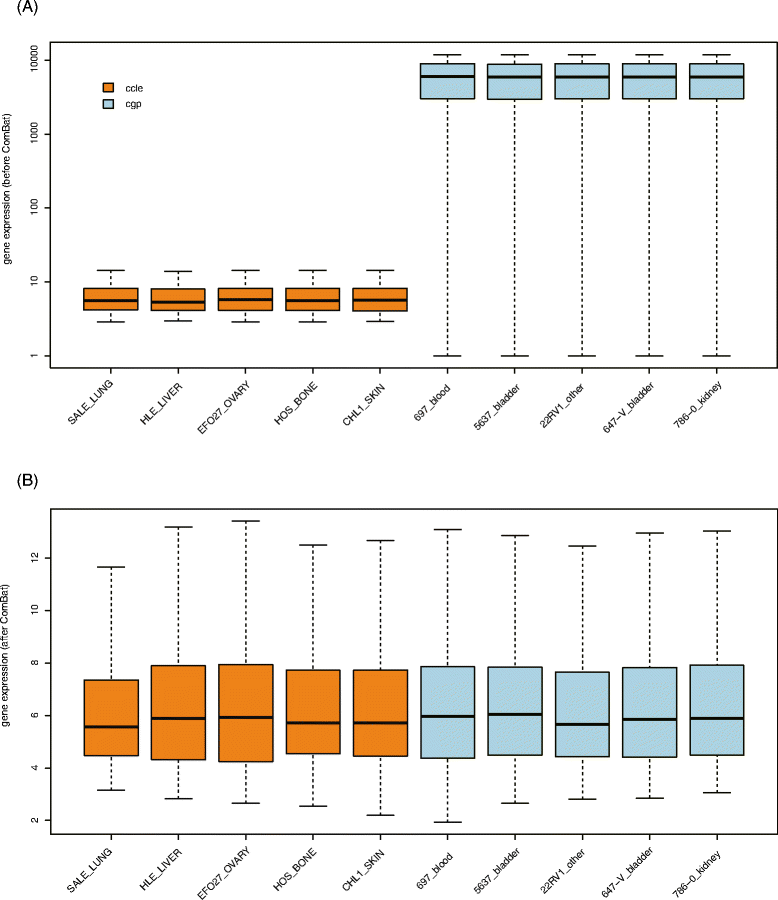
Elimination of Batch effect by ComBat. Boxplot showing gene expression distributions before (a) and after (b) ComBat for five cell lines in CCLE and CGP
Fig. 5
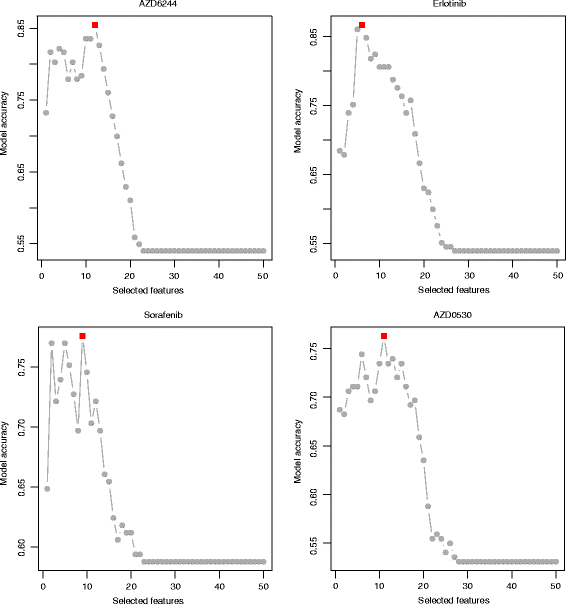
Prediction accuracy and number of selected features for four drugs. Prediction accuracies at different numbers of selected top features for four drugs, i.e., AZD6244, Erlotinib, Sorafenib and AZD0530. The optimal feature numbers are highlighted in red
Fig. 6
Cross validation results for CCLE drugs. For each drug in CCLE, model accuracy was obtained through a 10-fold cross validation. Barplot shows accuracy values for all drugs in CCLE
Fig. 7
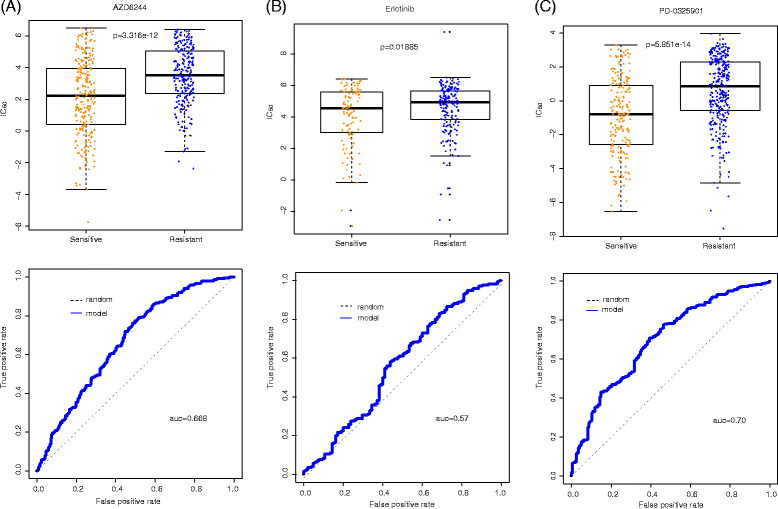
Independent tests on CCLE model for AZD6244, Erlotinib and PD-0325901. Boxplot and ROC curve (the bottom curve indicates drug response, measured as the area over the dose–response curve, i.e., activity area) have been built to evaluate the svm model. (a) For drug AZD6244, p-value by t test is 3.316e-12 and area under the curve is 0.668. (b) For drug Erlotinib, p-value by T test is 0.01885 and area under the curve is 0.57. (c) For drug PD-0325901, p-value by t test is 5.851e-14 and area under the curve is 0.70
Similar articles
- Comparison and validation of genomic predictors for anticancer drug sensitivity.
Papillon-Cavanagh S, De Jay N, Hachem N, Olsen C, Bontempi G, Aerts HJ, Quackenbush J, Haibe-Kains B. Papillon-Cavanagh S, et al. J Am Med Inform Assoc. 2013 Jul-Aug;20(4):597-602. doi: 10.1136/amiajnl-2012-001442. Epub 2013 Jan 26. J Am Med Inform Assoc. 2013. PMID: 23355484 Free PMC article. - Computational identification of multi-omic correlates of anticancer therapeutic response.
Stetson LC, Pearl T, Chen Y, Barnholtz-Sloan JS. Stetson LC, et al. BMC Genomics. 2014;15 Suppl 7(Suppl 7):S2. doi: 10.1186/1471-2164-15-S7-S2. Epub 2014 Oct 27. BMC Genomics. 2014. PMID: 25573145 Free PMC article. - Improved anticancer drug response prediction in cell lines using matrix factorization with similarity regularization.
Wang L, Li X, Zhang L, Gao Q. Wang L, et al. BMC Cancer. 2017 Aug 2;17(1):513. doi: 10.1186/s12885-017-3500-5. BMC Cancer. 2017. PMID: 28768489 Free PMC article. - Current Trends in Drug Sensitivity Prediction.
Cortes-Ciriano I, Mervin LH, Bender A. Cortes-Ciriano I, et al. Curr Pharm Des. 2016;22(46):6918-6927. doi: 10.2174/1381612822666161026154430. Curr Pharm Des. 2016. PMID: 27784247 Review. - [Polygenetic pharmacogenomic strategies to identify drug sensitivity biomarkers].
Nishiyama M. Nishiyama M. Gan To Kagaku Ryoho. 2005 Nov;32(12):1902-7. Gan To Kagaku Ryoho. 2005. PMID: 16282724 Review. Japanese.
Cited by
- Drug response prediction using graph representation learning and Laplacian feature selection.
Xie M, Lei X, Zhong J, Ouyang J, Li G. Xie M, et al. BMC Bioinformatics. 2022 Dec 9;23(Suppl 8):532. doi: 10.1186/s12859-022-05080-4. BMC Bioinformatics. 2022. PMID: 36494630 Free PMC article. - Cancer drug sensitivity prediction from routine histology images.
Dawood M, Vu QD, Young LS, Branson K, Jones L, Rajpoot N, Minhas FUAA. Dawood M, et al. NPJ Precis Oncol. 2024 Jan 6;8(1):5. doi: 10.1038/s41698-023-00491-9. NPJ Precis Oncol. 2024. PMID: 38184744 Free PMC article. - An overview of machine learning methods for monotherapy drug response prediction.
Firoozbakht F, Yousefi B, Schwikowski B. Firoozbakht F, et al. Brief Bioinform. 2022 Jan 17;23(1):bbab408. doi: 10.1093/bib/bbab408. Brief Bioinform. 2022. PMID: 34619752 Free PMC article. - AI in medicine: Where are we now and where are we going?
Shandhi MMH, Dunn JP. Shandhi MMH, et al. Cell Rep Med. 2022 Dec 20;3(12):100861. doi: 10.1016/j.xcrm.2022.100861. Cell Rep Med. 2022. PMID: 36543109 Free PMC article. - An omics perspective on drug target discovery platforms.
Paananen J, Fortino V. Paananen J, et al. Brief Bioinform. 2020 Dec 1;21(6):1937-1953. doi: 10.1093/bib/bbz122. Brief Bioinform. 2020. PMID: 31774113 Free PMC article.
References
- Barretina J, Caponigro G, Stransky N, Venkatesan K, Margolin AA, Kim S, Wilson CJ, Lehar J, Kryukov GV, Sonkin D, et al. The Cancer Cell Line Encyclopedia enables predictive modelling of anticancer drug sensitivity (vol 483, pg 603, 2012) Nature. 2012;492(7428):290–290. doi: 10.1038/nature11735. - DOI - PMC - PubMed
Publication types
MeSH terms
Substances
LinkOut - more resources
Full Text Sources
Other Literature Sources
