Molecular basis for 5-carboxycytosine recognition by RNA polymerase II elongation complex - PubMed (original) (raw)
. 2015 Jul 30;523(7562):621-5.
doi: 10.1038/nature14482. Epub 2015 Jun 29.
Affiliations
- PMID: 26123024
- PMCID: PMC4521995
- DOI: 10.1038/nature14482
Molecular basis for 5-carboxycytosine recognition by RNA polymerase II elongation complex
Lanfeng Wang et al. Nature. 2015.
Abstract
DNA methylation at selective cytosine residues (5-methylcytosine (5mC)) and their removal by TET-mediated DNA demethylation are critical for setting up pluripotent states in early embryonic development. TET enzymes successively convert 5mC to 5-hydroxymethylcytosine (5hmC), 5-formylcytosine (5fC), and 5-carboxylcytosine (5caC), with 5fC and 5caC subject to removal by thymine DNA glycosylase (TDG) in conjunction with base excision repair. Early reports indicate that 5fC and 5caC could be stably detected on enhancers, promoters and gene bodies, with distinct effects on gene expression, but the mechanisms have remained elusive. Here we determined the X-ray crystal structure of yeast elongating RNA polymerase II (Pol II) in complex with a DNA template containing oxidized 5mCs, revealing specific hydrogen bonds between the 5-carboxyl group of 5caC and the conserved epi-DNA recognition loop in the polymerase. This causes a positional shift for incoming nucleoside 5'-triphosphate (NTP), thus compromising nucleotide addition. To test the implication of this structural insight in vivo, we determined the global effect of increased 5fC/5caC levels on transcription, finding that such DNA modifications indeed retarded Pol II elongation on gene bodies. These results demonstrate the functional impact of oxidized 5mCs on gene expression and suggest a novel role for Pol II as a specific and direct epigenetic sensor during transcription elongation.
Figures
Extended Data Figure 1. Electron density maps of Pol II EC-I and EC-II
a, 2Fo-Fc map (blue) of Rpb2 Q531 in epi-DNA recognition loop and the opposite 5caC in Pol II EC-I, contoured at 1.0 sigma. b, Fo-Fc omit map (green) of Pol II EC-I (with 5caC omission), contoured at 3.0 sigma. c, 2Fo-Fc map (blue) of GMPCPP paired with 5caC in Pol II EC-II, contoured at 1.0 sigma. d, Fo-Fc omit map (green) of Pol II EC-II (with GMPCPP and 5caC omission), contoured at 3.0 sigma.
Extended Data Figure 2. Structural comparison between Pol II EC-I, EC-II and Pol II EC containing unmodified C template and a matched GTP
a, Superimposition of Pol II EC-I and EC-II structures. Rpb2 Q531 and 5caC in EC-II are in magenta to differentiate between those counterparts in EC-I. These two structures are aligned using bridge helix region (Rpb1 822–840). b, Superposition of Pol II EC-II containing 5caC template and GMPCPP with Pol II EC with closed trigger loop (containing unmodified C template and GTP, PDB: 2E2H). The two structures are aligned using bridge helix region (Rpb1 822–840).
Extended Data Figure 3. Kinetic study of GTP incorporation opposite 5caC template by purified Pol II proteins
Representative kinetic parameters fitting curves from three independent experiments for GTP incorporation opposite 5caC template for Pol II wt (a), Pol II Q531H (b), and Pol II Q531A (c), respectively. (d) Purified Pol II wt, Pol II Q531H, and Pol II Q531A proteins used in the in vitro transcription experiments.
Extended Data Figure 4. Modeling potential similar interaction for recognition of 5fC and 5caC templates, but not for 5hmC, 5mC and C templates
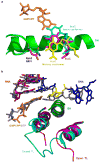
a, Hydrogen bonds (black dotted lines) between Rpb2 Q531, 5caC, and GMPCPP in EC-II. b, Model of the interaction between Pol II EC with 5fC template through the same hydrogen bonds interaction network. c, Model of Pol II EC with 5hmC template reveals no obvious hydrogen bonding between Q531 and 5hmC. The 5hmC nucleotide structure was based on PDB: 4R2C. d, Model of Pol II EC with 5mC template. e, Model of Pol II EC with unmodified C template. The above models were derived from the Pol II EC-II structure.
Extended Data Figure 5. Sequence alignment of Pol II epi-DNA recognition loop across different species
a, Pol II epi-DNA recognition loop (Rpb2 521–541) is conserved from fungi to human and strictly conserved among several fungal species highlighted with magenta dotted rectangle, which contains active TET/JBP enzymes. Key residues in the loop were highlighted in green box. b, Hydrogen bonds (black dotted lines) between yeast Pol II Rpb2 Q531, 5caC, and GMPCPP in EC-II. c, Model of human Pol II with the functionally equivalent His substitution based on EC-II structure. d, Comparison between Q531 and H531 substitution reveals the similar hydrogen bonding interaction.
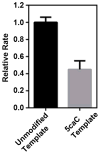
Extended Data Figure 6. Human Pol II slows down at 5caC template in comparison with unmodified template in the content of HeLa nuclear extract
The relative transcription elongation rate is normalized by the transcription elongation rate (kobs) from unmodified template. The relative rate from unmodified template and 5caC template are colored in black and gray, respectively. The error bars are standard deviations derived from three independent experiments.
Extended Data Figure 7. Comparison of purified yeast Pol II (upper panel) and E. coli RNAP (lower panel) transcription on 5caC template in comparison with unmodified template
Time points are 0, 5 s, 15 s, 30 s, 1 min, 5 min, 20 min, and 1 hr (left to right). The upper panel is identical to Fig. 1c and is placed here for direct comparison.
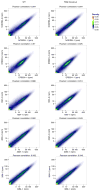
Extended Data Figure 8. Correlation between two replicates of GRO-seq data sets at different assay points
GRO-seq replicates (−1 and −2) were pairwise compared gene by gene on the normalized number of reads (rpm: reads per million total reads) for WT (left) and TDG KO (right) samples. The colors show the density of points or genes. The Pearson correlation coefficient were calculated from the points and shown on the top of each subfigure.
Figure 1
Pol II directly recognizes 5caC during transcription. a, Epigenetic modification cycle of cytosine. Cytosine (C), 5-methylcytosine (5mC), 5-hydroxylmethylcytosine (5hmC), 5-formylcytosine (5fC), and 5-carboxylcytosine (5caC). b, The RNA/DNA scaffold used in both structural and biochemical analysis. C* stands for 5caC residue. c, Impeded Pol II elongation on the 5caC-containing template relative to the unmodified C template. Time points are 0, 5 s, 15 s, 30 s, 1 min, 5 min, 20 min, and 1 hr (left to right). d, The overall Pol II EC structure containing a site-specific 5caC (EC-I). Color-coded are template DNA (blue), non-template DNA (green), and RNA (red). The two 5caC conformers are highlighted in yellow and cyan, respectively. Part of bridge helix (BH) (Rpb1 822–840) is highlighted in green and the rest of Pol II subunits are in gray (Rpb2 is omitted). The addition site is represented by a dotted oval. e, The midway 5caC interacts with the Rpb2 Q531 residue via hydrogen bonds (black dotted lines). The epi-DNA recognition loop (fork loop 3) (Rpb2 521–541) is shown in cyan. f, The Q531 side chain rotates 90 degrees to form hydrogen bonds with 5caC. Pol II EC-I is superimposed with the Pol II EC containing an unmodified DNA template in post-translocation state (PDB: 1SFO). The fork loop 3 region of Pol II EC (1SFO) is shown in orange. g–h, Comparison of two 5caC conformers (cyan or yellow) with the corresponding canonical template nucleotide (bluewhite).
Figure 2
Interaction between 5caC and epi-DNA recognition loop compromises GTP incorporation. a, The Pol II EC structure containing a matched GMPCPP opposite 5caC site (EC-II). The color codes are the same as Fig. 1 except for 5caC (yellow) and GMPCPP (orange). b–d, The GMPCPP:5caC base pair is shifted toward the downstream main channel from the canonical GMPCPP:dC position (PDB: 2E2J). The side chain of Rpb2 Q531 rotates 100 degrees to interact with 5caC (b and c). e–g, Comparison of catalytic rate constants (_k_pol) (e), substrate dissociation constants _K_d,app (f), and specificity constants (kpol/Kd,app) (g) of GTP incorporation opposite 5caC template by wt, Q531H, and Q531A Pol II, respectively. The mean values are presented and error bars are standard deviations derived from three independent experiments.
Figure 3
Similar “above-the-bridge-helix” translocation intermediates captured in pausing/arrested Pol II ECs and a common 5caC-recognition mode shared by a variety of 5caC-recognition proteins. a–c. Superimposition of 5caC-paused Pol II EC with CPD-lesion-arrested EC (PDB: 4A93) (a), pyriplatin-lesion-arrested EC (PDB: 3M4O) (b), and α-amanitin-arrested EC (PDB: 2VUM) (c), respectively. The similar “above-the-bridge-helix” translocation intermediates region for accommodation of i+1 5caC (yellow) and DNA lesion (or translocation intermediate captured by α-amanitin) (blutewhite) is highlighted by a red-dotted oval. The damage-arrested or α-amanitin-arrested Pol II ECs are shown in gray. d–f, The conserved interactions and residue involved 5caC recognition by Pol II (Rpb 2-Q531) (d), Wilms tumor protein 1 (Q369, PDB: 4R2R) (e), and human thymine DNA glycosylase (N157, PDB: 3UO7) (f).
Figure 4
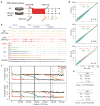
Impact of 5fC/5caC on Pol II transcription elongation in mouse embryonic stem cells (mESCs). a, Scheme of the DRB releasing assay. Wt and TDG-knockout mESCs were treated with DRB followed by washing out DRB to allow transcription for 10, 20, or 30 min. No DRB treatment (NODRB) or 3 hr DRB treatment (DRB3H) were performed as controls. All experiments were performed in duplicate and reproducibility was evident in all pairwise comparisons (Extended Data Fig. 8). b, The GRO-seq data on the representative Myo1e gene. Elevated 5fC/5caC levels in TDG-KO mESCs are derived from the published ChIP-seq data in duplicate. c, Comparative metagene analysis of GRO-seq signals between WT (upper) and KO mESCs (bottom). Dashed and non-dashed lines show the middle points of the ensemble transcription waves in WT and KO mESCs, respectively. d, Pairwise comparisons of the GRO-seq density (reads per million) of individual genes in the +/−10 kb window around different middle points between WT (x-axis) and KO cells (y-axis) in c (10M, 20M, 30M in cyan) with the NODRB data (red) as control. The coefficients are the slopes of the lines from linear regression on the scattered points. The _p_-values were calculated based on one-sided Kolmogorov-Smirnov test of comparing read density ratio (KO/WT) at 30 min. N: number of genes. e, Correlation between increased 5fC/5caC levels and retarded transcription elongation. Genes were divided into two groups according to increased 5fC/5caC levels in the gene bodies (low in group 1 and high in group 2). The numbers correspond to the middle point positions (bp) of the ensemble transcription waves relative to TSS in WT versus KO mESCs.
Comment in
- RNA Pol II as a sensor of 5caC.
Xue JH, Xu GL. Xue JH, et al. Cell Res. 2015 Oct;25(10):1089-90. doi: 10.1038/cr.2015.103. Epub 2015 Aug 28. Cell Res. 2015. PMID: 26315484 Free PMC article.
Similar articles
- Differential stabilities and sequence-dependent base pair opening dynamics of Watson-Crick base pairs with 5-hydroxymethylcytosine, 5-formylcytosine, or 5-carboxylcytosine.
Szulik MW, Pallan PS, Nocek B, Voehler M, Banerjee S, Brooks S, Joachimiak A, Egli M, Eichman BF, Stone MP. Szulik MW, et al. Biochemistry. 2015 Feb 10;54(5):1294-305. doi: 10.1021/bi501534x. Epub 2015 Jan 29. Biochemistry. 2015. PMID: 25632825 Free PMC article. - Weakened N3 Hydrogen Bonding by 5-Formylcytosine and 5-Carboxylcytosine Reduces Their Base-Pairing Stability.
Dai Q, Sanstead PJ, Peng CS, Han D, He C, Tokmakoff A. Dai Q, et al. ACS Chem Biol. 2016 Feb 19;11(2):470-7. doi: 10.1021/acschembio.5b00762. Epub 2015 Dec 17. ACS Chem Biol. 2016. PMID: 26641274 Free PMC article. - Genome-wide distribution of 5-formylcytosine in embryonic stem cells is associated with transcription and depends on thymine DNA glycosylase.
Raiber EA, Beraldi D, Ficz G, Burgess HE, Branco MR, Murat P, Oxley D, Booth MJ, Reik W, Balasubramanian S. Raiber EA, et al. Genome Biol. 2012 Aug 17;13(8):R69. doi: 10.1186/gb-2012-13-8-r69. Genome Biol. 2012. PMID: 22902005 Free PMC article. - Epigenetic modifications in DNA could mimic oxidative DNA damage: A double-edged sword.
Ito S, Kuraoka I. Ito S, et al. DNA Repair (Amst). 2015 Aug;32:52-57. doi: 10.1016/j.dnarep.2015.04.013. Epub 2015 May 1. DNA Repair (Amst). 2015. PMID: 25956859 Review. - MicroRNAs mediated targeting on the Yin-yang dynamics of DNA methylation in disease and development.
Tu J, Liao J, Luk AC, Tang NL, Chan WY, Lee TL. Tu J, et al. Int J Biochem Cell Biol. 2015 Oct;67:115-20. doi: 10.1016/j.biocel.2015.05.002. Epub 2015 May 12. Int J Biochem Cell Biol. 2015. PMID: 25979370 Review.
Cited by
- A Ni4O4-cubane-squarate coordination framework for molecular recognition.
Yan Q, An S, Yu L, Li S, Wu X, Dong S, Xiong S, Wang H, Wang S, Du J. Yan Q, et al. Nat Commun. 2024 Nov 15;15(1):9911. doi: 10.1038/s41467-024-54348-1. Nat Commun. 2024. PMID: 39548080 Free PMC article. - Bacteriophage-related epigenetic natural and non-natural pyrimidine nucleotides and their influence on transcription with T7 RNA polymerase.
Gracias F, Pohl R, Sýkorová V, Hocek M. Gracias F, et al. Commun Chem. 2024 Nov 9;7(1):256. doi: 10.1038/s42004-024-01354-5. Commun Chem. 2024. PMID: 39521867 Free PMC article. - RNA modifications in pulmonary diseases.
Qian W, Yang L, Li T, Li W, Zhou J, Xie S. Qian W, et al. MedComm (2020). 2024 May 3;5(5):e546. doi: 10.1002/mco2.546. eCollection 2024 May. MedComm (2020). 2024. PMID: 38706740 Free PMC article. Review. - Epigenetic marks or not? The discovery of novel DNA modifications in eukaryotes.
Meng WY, Wang ZX, Zhang Y, Hou Y, Xue JH. Meng WY, et al. J Biol Chem. 2024 Apr;300(4):106791. doi: 10.1016/j.jbc.2024.106791. Epub 2024 Feb 23. J Biol Chem. 2024. PMID: 38403247 Free PMC article. Review. - A Photoredox Reaction for the Selective Modification of 5-Carboxycytosine in DNA.
Mortishire-Smith BJ, Becker SM, Simeone A, Melidis L, Balasubramanian S. Mortishire-Smith BJ, et al. J Am Chem Soc. 2023 May 17;145(19):10505-10511. doi: 10.1021/jacs.2c12558. Epub 2023 May 4. J Am Chem Soc. 2023. PMID: 37141595 Free PMC article.
References
- Pfaffeneder T, et al. The discovery of 5-formylcytosine in embryonic stem cell DNA. Angew Chem Int Ed. 2011;50:7008–7012. - PubMed
Publication types
MeSH terms
Substances
Grants and funding
- HG004659/HG/NHGRI NIH HHS/United States
- R01 GM052872/GM/NIGMS NIH HHS/United States
- GM102362/GM/NIGMS NIH HHS/United States
- R01 HG004659/HG/NHGRI NIH HHS/United States
- GM052872/GM/NIGMS NIH HHS/United States
- HG006827/HG/NHGRI NIH HHS/United States
- Howard Hughes Medical Institute/United States
- R01 GM102362/GM/NIGMS NIH HHS/United States
- R01 HG006827/HG/NHGRI NIH HHS/United States
LinkOut - more resources
Full Text Sources
Other Literature Sources
Molecular Biology Databases


