Suppression of hyperinsulinaemia in growing female mice provides long-term protection against obesity - PubMed (original) (raw)
Suppression of hyperinsulinaemia in growing female mice provides long-term protection against obesity
Nicole M Templeman et al. Diabetologia. 2015 Oct.
Abstract
Aims/hypothesis: Hyperinsulinaemia is associated with obesity but its causal role in the onset of obesity remains controversial. In this study, we tested the hypothesis that transient attenuation of diet-induced insulin hypersecretion in young mice can provide sustained protection against obesity throughout adult life.
Methods: Using 'genetically humanised' mice lacking both alleles of rodent-specific Ins1, we compared mice heterozygous for the ancestral insulin gene Ins2 with Ins2(+/+) controls. Female Ins1(-/-):Ins2(+/-) and Ins1(-/-):Ins2(+/+) littermates were fed chow or high-fat diet (HFD). Insulin secretion, metabolic health variables and body mass/composition were tracked for over 1 year. We examined islet function and adipose transcript levels of adipogenic, lipogenic and lipolytic genes at two time points.
Results: In control Ins1(-/-):Ins2(+/+) mice, HFD resulted in elevated fasting and glucose-stimulated insulin secretion between 8 weeks and 27 weeks of age. Hyperinsulinaemia was reduced by nearly 50% in Ins1(-/-):Ins2(+/-) mice during this period, without lasting adverse effects on glucose homeostasis. This corresponded with attenuated weight gain and adiposity. White adipose tissue from Ins1(-/-):Ins2(+/-) mice had fewer large lipid droplets, although transcriptional changes were not detected. Importantly, Ins1(-/-):Ins2(+/-) mice remained lighter than Ins1(-/-):Ins2(+/+) littermates despite reaching an equivalent degree of hyperinsulinaemia on HFD by 52 weeks.
Conclusions/interpretation: These data demonstrate that attenuation of hyperinsulinaemia in young, growing female mice provides a long-lasting protection against obesity. This protection persists despite a late-onset emergence of hyperinsulinaemia in HFD-fed Ins1(-/-):Ins2(+/-) mice. Given the evolutionary conserved roles of insulin, it is possible that suppressing hyperinsulinaemia early in life may have far-reaching consequences on obesity in full-grown adult humans.
Keywords: Adolescence; Diet-induced obesity; Glucose homeostasis; Insulin; Knockout mice; Type 2 diabetes.
Figures
Fig. 1
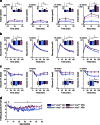
Transiently attenuated HFD-induced hyperinsulinaemia in Ins1 −/−:Ins2 +/− mice. (a) Experimental design of Ins1 −/−:Ins2 +/+ and Ins1 −/−:Ins2 +/− littermates fed CD or HFD. (b, c) Islet Ins2 mRNA is corrected against β-actin mRNA and normalised to CD-fed Ins1 −/−:Ins2 +/+ mice at 25 weeks (n = 3–5) (b), or HFD-fed Ins1 −/−:Ins2 +/+ mice at 50 weeks (n = 3) (c). (d, e) Insulin content in islets from mice at 25 (d) and 50 weeks (e). (f–h) At 25 (f, g) and 50 weeks (h), insulin secretion by 150 islets perifused with basal 3 mmol/l glucose followed by stimulatory 15 mmol/l glucose (Glu) or 30 mmol/l KCl, with AUC (insets; _y_-axis units, pmol/l × min) depicted, including phases I/II of glucose stimulation (n = 3). (i, j) Fasted insulin (n = 17–21) (i) and C-peptide (n = 5–6) (j) at 27 weeks is from in vivo sampling. Dark blue, CD-fed Ins1 −/−:Ins2 +/+ mice; dark purple, HFD-fed Ins1 −/−:Ins2 +/+ mice; light blue, CD-fed Ins1 −/−:Ins2 +/− mice; light purple, HFD-fed Ins1 −/−:Ins2 +/− mice. Data are means ± SEM. *p ≤ 0.05, CD vs HFD; † p ≤ 0.05, Ins1 −/−:Ins2 +/+ vs Ins1 −/−:Ins2 +/−
Fig. 2
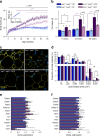
Longitudinal glucose homeostasis. Periodic measurements of glucose-stimulated insulin secretion (n = 17–21) (a), blood glucose responses to intraperitoneal glucose (n = 29–34) (b) and insulin analogue (n = 29–34) (c) are shown, together with AUC or area over curve (AOC) (insets, _y_-axis units, pmol/l × min [a], mmol/l × min [b] and % × min [c]) and fasted blood glucose (n = 15–18, most time points) (d). Dark blue, CD-fed Ins1 −/−:Ins2 +/+ mice; dark purple, HFD-fed Ins1 −/−:Ins2 +/+ mice; light blue, CD-fed Ins1 −/−:Ins2 +/− mice; light purple, HFD-fed Ins1 −/−:Ins2 +/− mice. Data are means ± SEM. *p ≤ 0.05, CD vs HFD; † p ≤ 0.05, Ins1 −/−:Ins2 +/+ vs Ins1 −/−:Ins2 +/−
Fig. 3
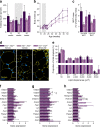
Attenuated obesity in HFD-fed Ins1 −/−:Ins2 +/− mice. (a) Body mass was tracked in pups (n = 19–29, inset) and weaned mice (n = 29–33, most time points). (b) DEXA-measured fat mass is shown (n = 8–11). (c, d) Staining (magnification ×50) for perilipin (yellow) and DAPI (blue) in gonadal WAT of 25-week-old mice (c) is quantified (n = 3) in (d) as frequency per size category. (e, f) Gene expression in gonadal (e) and inguinal (f) WAT mRNA is corrected against Hprt and normalised to CD-fed Ins1 −/−:Ins2 +/+ mice. Dark blue, CD-fed Ins1 −/−:Ins2 +/+ mice; dark purple, HFD-fed Ins1 −/−:Ins2 +/+ mice; light blue, CD-fed Ins1 −/−:Ins2 +/− mice; light purple, HFD-fed Ins1 −/−:Ins2 +/− mice. Data are means ± SEM. *p ≤ 0.05, (*) p = 0.051, CD vs HFD; † p ≤ 0.05, (†) p = 0.054, Ins1 −/−:Ins2 +/+ vs Ins1 −/−:Ins2 +/−; *+/+ p ≤ 0.05, CD-fed vs HFD-fed Ins1 −/−:Ins2 +/+ mice; *+/− p ≤ 0.05, CD-fed vs HFD-fed Ins1 −/−:Ins2 +/− mice; †HFD p ≤ 0.05, HFD-fed Ins1 −/−:Ins2 +/+ vs Ins1 −/−:Ins2 +/− mice
Fig. 4
Plasma lipids and metabolic factors. Fasted levels of cholesterol (a), triacylglycerols (b), NEFA (c), leptin (d), resistin (e), interleukin 6 (f), GIP (g), peptide YY (h) and glucagon (i) in 40-week-old mice (n = 8–12). Dark blue, CD-fed Ins1 −/−:Ins2 +/+ mice; dark purple, HFD-fed Ins1 −/−:Ins2 +/+ mice; light blue, CD-fed Ins1 −/−:Ins2 +/− mice; light purple, HFD-fed Ins1 −/−:Ins2 +/− mice. Data are means ± SEM. *p ≤ 0.05, CD vs HFD; *+/+ p ≤ 0.05, CD-fed vs HFD-fed Ins1 −/−:Ins2 +/+ mice; †HFD p ≤ 0.05, HFD-fed Ins1 −/−:Ins2 +/+ vs Ins1 −/−:Ins2 +/− mice
Fig. 5
Energy homeostasis and brown adipose tissue. (a–d) In HFD-fed 17-week-old mice (n = 6–8), 24 h activity (a), food intake (b), respiratory exchange ratio (c) and energy expenditure (d) were averaged across 48–84 h; the dark period is shown in grey. (e, f) In 25-week-old mice (n = 5–7), BAT depot mass is shown as absolute values (e) and proportional to body mass (f). (g) mRNA levels of genes expressed in BAT are corrected against Tbp and normalised to levels in CD-fed Ins1 −/−:Ins2 +/+ mice. Dark blue, CD-fed Ins1 −/−:Ins2 +/+ mice; dark purple, HFD-fed Ins1 −/−:Ins2 +/+ mice; light blue, CD-fed Ins1 −/−:Ins2 +/− mice; light purple, HFD-fed Ins1 −/−:Ins2 +/− mice. Energy expenditure is shown as estimated marginal means ± SEM, adjusted for covariates of lean and fat mass; other data are simple means ± SEM. *p ≤ 0.05, CD vs HFD; † p ≤ 0.05, Ins1 −/−:Ins2 +/+ vs Ins1 −/−:Ins2 +/−
Fig. 6
Long-term effects of HFD and INSULIN2. Mice were implanted with pumps releasing INSULIN2 or vehicle for 4 weeks (indicated by grey hatching). (a) Fasted insulin levels, n = 3. (b) Body mass, n = 3. (c–e) At 50 weeks, characterisation included WAT depot weight proportional to body mass (c) and gonadal WAT staining (magnification ×50) for perilipin (yellow) and DAPI (blue) (d) (n = 3; quantification is shown in e as frequency per size category). (f–h) mRNA levels of genes expressed in gonadal WAT (f), inguinal WAT (g) and BAT (h) are corrected against Tbp or Hprt, and normalised to levels in Ins1 −/−:Ins2 +/+ mice. Dark purple, vehicle-treated Ins1 −/−:Ins2 +/+ mice; light purple, vehicle-treated Ins1 −/−:Ins2 +/− mice; hatched bars and triangles, INSULIN2-treated Ins1 −/−:Ins2 +/− mice. Data are means ± SEM. ‡ p ≤ 0.05, for the indicated comparisons; (‡) p = 0.058 in (f) for group effect; and (‡) p ≤ 0.057 in (h) for the indicated comparisons
Similar articles
- Hyper-Variability in Circulating Insulin, High Fat Feeding Outcomes, and Effects of Reducing Ins2 Dosage in Male Ins1-Null Mice in a Specific Pathogen-Free Facility.
Templeman NM, Mehran AE, Johnson JD. Templeman NM, et al. PLoS One. 2016 Apr 7;11(4):e0153280. doi: 10.1371/journal.pone.0153280. eCollection 2016. PLoS One. 2016. PMID: 27055260 Free PMC article. - Hyperinsulinemia drives diet-induced obesity independently of brain insulin production.
Mehran AE, Templeman NM, Brigidi GS, Lim GE, Chu KY, Hu X, Botezelli JD, Asadi A, Hoffman BG, Kieffer TJ, Bamji SX, Clee SM, Johnson JD. Mehran AE, et al. Cell Metab. 2012 Dec 5;16(6):723-37. doi: 10.1016/j.cmet.2012.10.019. Cell Metab. 2012. PMID: 23217255 - Suppressing hyperinsulinemia prevents obesity but causes rapid onset of diabetes in leptin-deficient _Lep_ob/ob mice.
D'souza AM, Johnson JD, Clee SM, Kieffer TJ. D'souza AM, et al. Mol Metab. 2016 Sep 21;5(11):1103-1112. doi: 10.1016/j.molmet.2016.09.007. eCollection 2016 Nov. Mol Metab. 2016. PMID: 27818936 Free PMC article. - Insulin translates unfavourable lifestyle into obesity.
Kolb H, Stumvoll M, Kramer W, Kempf K, Martin S. Kolb H, et al. BMC Med. 2018 Dec 13;16(1):232. doi: 10.1186/s12916-018-1225-1. BMC Med. 2018. PMID: 30541568 Free PMC article. Review. - A causal role for hyperinsulinemia in obesity.
Templeman NM, Skovsø S, Page MM, Lim GE, Johnson JD. Templeman NM, et al. J Endocrinol. 2017 Mar;232(3):R173-R183. doi: 10.1530/JOE-16-0449. Epub 2017 Jan 4. J Endocrinol. 2017. PMID: 28052999 Review.
Cited by
- Characterizing the effects of Dechlorane Plus on β-cells: a comparative study across models and species.
van Allen KA, Gang N, Hoyeck MP, Perera I, Zhang D, Atlas E, Lynn FC, Bruin JE. van Allen KA, et al. Islets. 2024 Dec 31;16(1):2361996. doi: 10.1080/19382014.2024.2361996. Epub 2024 Jun 4. Islets. 2024. PMID: 38833523 Free PMC article. - The effects of purslane consumption on blood pressure, body weight, body mass index, and waist circumference: a systematic review and meta-analysis of randomised controlled.
Narimani B, Amini MR, Sheikhhossein F, Akhgarjand C, Gholizadeh M, Askarpour M, Hekmatdoost A. Narimani B, et al. J Nutr Sci. 2023 Dec 27;12:e129. doi: 10.1017/jns.2023.115. eCollection 2023. J Nutr Sci. 2023. PMID: 38155802 Free PMC article. - Alterations in Adipose Tissue Distribution, Cell Morphology, and Function Mark Primary Insulin Hypersecretion in Youth With Obesity.
Tricò D, Chiriacò M, Nouws J, Vash-Margita A, Kursawe R, Tarabra E, Galderisi A, Natali A, Giannini C, Hellerstein M, Ferrannini E, Caprio S. Tricò D, et al. Diabetes. 2024 Jun 1;73(6):941-952. doi: 10.2337/db23-0450. Diabetes. 2024. PMID: 37870826 Free PMC article. - Slc12a2 loss in insulin-secreting β-cells links development of overweight and metabolic dysregulation to impaired satiation control of feeding.
Rathod YD, Abdelgawad R, Hübner CA, Di Fulvio M. Rathod YD, et al. Am J Physiol Endocrinol Metab. 2023 Nov 1;325(5):E581-E594. doi: 10.1152/ajpendo.00197.2023. Epub 2023 Oct 11. Am J Physiol Endocrinol Metab. 2023. PMID: 37819196 Free PMC article. - Obesity Duration and Cardiometabolic Disease.
Sidhu SK, Aleman JO, Heffron SP. Sidhu SK, et al. Arterioscler Thromb Vasc Biol. 2023 Oct;43(10):1764-1774. doi: 10.1161/ATVBAHA.123.319023. Epub 2023 Aug 31. Arterioscler Thromb Vasc Biol. 2023. PMID: 37650325 Free PMC article. Review.
References
- World Health Organization . Obesity and overweight, fact sheet 311. Geneva: WHO; 2013. pp. 1–4.
Publication types
MeSH terms
Substances
LinkOut - more resources
Full Text Sources
Other Literature Sources
Medical
Molecular Biology Databases


