Dynamic tensile forces drive collective cell migration through three-dimensional extracellular matrices - PubMed (original) (raw)
Dynamic tensile forces drive collective cell migration through three-dimensional extracellular matrices
Nikolce Gjorevski et al. Sci Rep. 2015.
Abstract
Collective cell migration drives tissue remodeling during development, wound repair, and metastatic invasion. The physical mechanisms by which cells move cohesively through dense three-dimensional (3D) extracellular matrix (ECM) remain incompletely understood. Here, we show directly that migration of multicellular cohorts through collagenous matrices occurs via a dynamic pulling mechanism, the nature of which had only been inferred previously in 3D. Tensile forces increase at the invasive front of cohorts, serving a physical, propelling role as well as a regulatory one by conditioning the cells and matrix for further extension. These forces elicit mechanosensitive signaling within the leading edge and align the ECM, creating microtracks conducive to further migration. Moreover, cell movements are highly correlated and in phase with ECM deformations. Migrating cohorts use spatially localized, long-range forces and consequent matrix alignment to navigate through the ECM. These results suggest biophysical forces are critical for 3D collective migration.
Figures
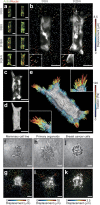
Figure 1. Epithelial cells migrate collectively by exerting tensile forces on the surrounding 3D matrix.
(a) Confocal fluorescence images showing collective migration of mammary epithelial tissues labeled with LifeAct-GFP (green) and H2B-mCherry (red) in type I collagen gels over 24 hours. Images are representative of three independent replicates in which >50 tissues were monitored. (b) Confocal slice of tissues labeled with LifeAct-GFP at 0 and 20 hours. Resulting displacements of >100 beads embedded in the matrix are superimposed. Images are representative of four independent replicates in which >50 tissues were monitored. (c) Confocal stacks of a tissue labeled with LifeAct-GFP were used to reconstruct (d) the surface of the tissue and the migrating cohorts. (e) A map of estimated traction forces exerted by collectively migrating epithelial cells. The displacements of >1000 beads embedded within the matrix were used to estimate the traction forces exerted by the tissue during collective migration. Images and displacements are representative of three independent replicates. (f) Phase contrast image of a cluster of mammary epithelial cells in a type I collagen gel undergoing collective migration. Image is representative of three independent replicates in which >5 tissues were monitored. (g) Confocal slice of the collectively migrating mammary epithelial cell cluster in (f) labeled with LifeAct-GFP. Resulting displacements of >100 beads embedded in the matrix are superimposed on the image. (h) Phase contrast image of a primary mammary organoid in a type I collagen gel undergoing collective migration. Image is representative of three independent replicates in which >5 organoids were monitored. (i) Confocal slice of the collectively migrating primary mammary organoid in (h) labeled with LifeAct-GFP. Resulting displacements of >100 beads embedded in the matrix are superimposed on the image. (j) Phase contrast image of a cluster of breast cancer cells in a type I collagen gel undergoing collective invasion. Image is representative of three independent replicates in which >20 clusters were monitored. (k) Confocal slice of the cluster of invasive cancer cells in (j) labeled with LifeAct-GFP. Resulting displacements of >100 beads embedded in the matrix are superimposed on the image. Scale bars, 50 μm.
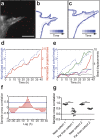
Figure 2. Collectively migrating cohorts exhibit dynamic changes in shape, which are in phase and correlated with surrounding matrix deformations.
(a) Confocal fluorescence image of a collectively migrating cohort after 40 hours of live imaging with bead displacements superimposed (red). Image is representative of 4 independent replicates. Within a single experiment, four tissues were monitored. Contours of the migrating cohort in (a) from (b) 0 to 20 hours and from (c) 20 to 40 hours; darker colors represent later time points. (d) Plot of normalized cohort length (blue, dashed line) and projected area (red, solid line) for the cohort in (a). (e) Plot of normalized cohort length (blue, dashed line) and displacements (various colors, solid lines) of beads near (<50 μm) the migrating cohort in (**a**). Displacements are representative of 18 tracks analyzed. Also included is the displacement (black, dotted line) of one bead located far (>50 μm) from the migrating cohort. (f) Sample cross correlation plot comparing variations in cohort length to the displacement of a bead located near the migrating cohort (sample cross covariance). Plot is representative of 18 displacement tracks analyzed. (g) Cross correlation coefficients comparing temporal change in cohort length to the displacement trajectories of fluorescent beads near the cohort and far from the cohort for two separate representative samples. Mean of four replicates is shown. Beads near cohort 1: n = 7; beads far from cohort 1: n = 11; beads near cohort 2: n = 7; beads far from cohort 2: n = 7. ***P < 0.001, Student’s _t_-test. Scale bar, 50 μm.
Figure 3. Tensile forces drive collective migration by activating mechanically sensitive intracellular signaling and transcription factors.
(a) Phase contrast images showing collective migration from representative tissues treated with DMSO (control) or blebbistatin (12.5 μM). (b) Quantification of cohort length from tissues treated with DMSO or blebbistatin. Mean ± s.e.m. of three replicates is shown, n = 60 tissues per group. **P < 0.01, Student’s _t_-test. Immunofluorescence staining for FAK pY397 and phospho-p130Cas in representative DMSO (**c**) and blebbistatin-treated (**d**) migrating cohorts. (**e**) Confocal image showing immunofluorescence staining for MRTF-A localization (green) and nuclei (red) in a representative tissue. (**f**) Quantification of the localization of MRTF-A (nucleus/cytoplasm) in tissues. Levels of nuclear and cytoplasmic MRTF-A were quantified by measuring signal intensity in the two compartments. Mean ± s.e.m. of three replicates is shown. Migrating cohort (invasion): n = 14; quiescent body: n = 11. **_P_ < 0.01, Student’s _t_-test. (**g**) Confocal image showing immunofluorescence staining for MRTF-A localization (green) and nuclei (red) in representative tissues treated with DMSO or blebbistatin. (**h**) Quantification of the localization of MRTF-A (nucleus/cytoplasm) in tissues treated with DMSO or blebbistatin. Levels of nuclear and cytoplasmic MRTF-A were quantified by measuring signal intensity in the two compartments. Mean ± s.e.m. of three replicates is shown. MRTF-A DMSO: n = 29; MRTF-A blebbistatin: n = 21; DAPI DMSO: n = 10; DAPI blebbistatin: n = 12. **_P_ < 0.01, Student’s _t_-test. (**i**) Phase contrast images showing collective migration from representative tissues treated with DMSO or CCG-1423 (10 μM). (**j**) Quantification of cohort length from tissues treated with DMSO or CCG-1423. Mean ± sem. of three replicates is shown. Invading cohorts treated with DMSO: n=80; invading cohorts treated with CCG-1423: n = 57. **_P_ < 0.01, Student’s _t_-test. (**k**) Frequency maps showing collective invasion from 34 tissues (three independent replicates) transfected with scrambled shRNA (shScr) or shMRTF-A (two constructs). (**l**) Quantification of cohort length from tissues transfected with shScr or shMRTF-A. Mean ± s.e.m. of three replicates is shown, n = 50 tissues per group. ***_P_ < 0.001, Student’s _t_-test. All images are representative of three independent replicates in which >50 tissues were monitored. Scale bars, 50 μm (a,i,k), 25 μm (c,d,e,g).
Figure 4. Tensile forces remodel matrix at the leading edge of migrating cohorts.
(a) Representative phase contrast image showing cells invading from a mammary epithelial cell cluster. (b) Confocal reflection image depicting the structure of the collagen matrix surrounding the tissue in (a). (c) Merged image of (a) and (b). High magnification images showing the structure of the collagen (d) far from the invading tissue in (a) and (f) adjacent to the invasive front of the tissue in (a). (e) Rose plot showing fibril angles far from the tissue in (a). Histogram represents fiber angles computed at 900 image locations within (d). (g) Rose plot showing fibril angles adjacent to the invasive front of the tissue in (a). Histogram represents fiber angles computed at 900 image locations within (f). Red line indicates the direction of collective invasion. All images are representative of three independent replicates. Scale bars, 50 μm (a–c), 25 μm (d,f).
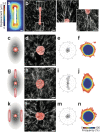
Figure 5. Matrix alignment spatially directs collective migration.
(a) Heat map showing matrix deformation around rectangular tissues. The average magnitude of matrix deformation arising from forces generated by >10 microfabricated tissues is shown. Matrix deformations caused by a single tissue were determined by tracking >100 beads embedded in the surrounding collagen. Heat map is representative of >20 independent replicates. (b) Confocal reflection image showing the structure of collagen surrounding a representative rectangular epithelial tissue labeled with DiI (red) before the tissue undergoes collective migration. Also shown are high magnification images of regions of fibril alignment near the tips of the rectangular tissue. (c) Schematic and (d) confocal reflection image of collagen surrounding a representative circular tissue labeled with DiI (red) before the tissue undergoes collective migration. (e) Rose plot showing the angles of collective invasion from 66 circular tissues (three independent replicates). (f) Frequency map representing collective migration from 66 circular tissues (three independent replicates). (g) Schematic and (h) confocal reflection image of collagen surrounding a representative circular tissue labeled with DiI (red) exposed to regions of fibril alignment before the tissue undergoes collective migration. (i) Rose plot showing the angles of collective invasion from 83 tissues (three independent replicates) in the configuration shown in (g). (j) Frequency map representing collective migration from 83 tissues (three independent replicates) in the configuration shown in (g). (k) Schematic and (l) confocal reflection image of collagen matrix surrounding a representative circular tissue labeled with DiI (red) proximal to rectangular tissues, but not exposed to regions of preferential fibril alignment before the tissue undergoes collective migration. (m) Rose plot showing the angles of collective invasion from 53 tissues (three independent replicates) in the configuration shown in (k). (n) Frequency map representing collective migration from 53 tissues (three independent replicates) in the configuration shown in (k). All images are representative of three independent replicates. Scale bars, 50 μm.
Similar articles
- Individual versus collective fibroblast spreading and migration: regulation by matrix composition in 3D culture.
Miron-Mendoza M, Lin X, Ma L, Ririe P, Petroll WM. Miron-Mendoza M, et al. Exp Eye Res. 2012 Jun;99:36-44. doi: 10.1016/j.exer.2012.03.015. Exp Eye Res. 2012. PMID: 22838023 Free PMC article. - Modeling cell migration regulated by cell extracellular-matrix micromechanical coupling.
Zheng Y, Nan H, Liu Y, Fan Q, Wang X, Liu R, Liu L, Ye F, Sun B, Jiao Y. Zheng Y, et al. Phys Rev E. 2019 Oct;100(4-1):043303. doi: 10.1103/PhysRevE.100.043303. Phys Rev E. 2019. PMID: 31770879 - Comparative mechanisms of cancer cell migration through 3D matrix and physiological microtracks.
Carey SP, Rahman A, Kraning-Rush CM, Romero B, Somasegar S, Torre OM, Williams RM, Reinhart-King CA. Carey SP, et al. Am J Physiol Cell Physiol. 2015 Mar 15;308(6):C436-47. doi: 10.1152/ajpcell.00225.2014. Epub 2014 Dec 10. Am J Physiol Cell Physiol. 2015. PMID: 25500742 Free PMC article. - Techniques for assessing 3-D cell-matrix mechanical interactions in vitro and in vivo.
Miron-Mendoza M, Koppaka V, Zhou C, Petroll WM. Miron-Mendoza M, et al. Exp Cell Res. 2013 Oct 1;319(16):2470-80. doi: 10.1016/j.yexcr.2013.06.018. Epub 2013 Jun 29. Exp Cell Res. 2013. PMID: 23819988 Free PMC article. Review. - Determinants of leader cells in collective cell migration.
Khalil AA, Friedl P. Khalil AA, et al. Integr Biol (Camb). 2010 Nov;2(11-12):568-74. doi: 10.1039/c0ib00052c. Epub 2010 Oct 1. Integr Biol (Camb). 2010. PMID: 20886167 Review.
Cited by
- A toolbox to explore the mechanics of living embryonic tissues.
Campàs O. Campàs O. Semin Cell Dev Biol. 2016 Jul;55:119-30. doi: 10.1016/j.semcdb.2016.03.011. Epub 2016 Apr 6. Semin Cell Dev Biol. 2016. PMID: 27061360 Free PMC article. Review. - The Role of Desmoplasia and Stromal Fibroblasts on Anti-cancer Drug Resistance in a Microengineered Tumor Model.
Saini H, Rahmani Eliato K, Silva C, Allam M, Mouneimne G, Ros R, Nikkhah M. Saini H, et al. Cell Mol Bioeng. 2018 Jul 31;11(5):419-433. doi: 10.1007/s12195-018-0544-9. eCollection 2018 Oct. Cell Mol Bioeng. 2018. PMID: 31719892 Free PMC article. - Mechanophenotyping of 3D multicellular clusters using displacement arrays of rendered tractions.
Leggett SE, Patel M, Valentin TM, Gamboa L, Khoo AS, Williams EK, Franck C, Wong IY. Leggett SE, et al. Proc Natl Acad Sci U S A. 2020 Mar 17;117(11):5655-5663. doi: 10.1073/pnas.1918296117. Epub 2020 Mar 2. Proc Natl Acad Sci U S A. 2020. PMID: 32123100 Free PMC article. - Phenotypic Heterogeneity and Plasticity of Cancer Cell Migration in a Pancreatic Tumor Three-Dimensional Culture Model.
Kim SK, Jang SD, Kim H, Chung S, Park JK, Kuh HJ. Kim SK, et al. Cancers (Basel). 2020 May 21;12(5):1305. doi: 10.3390/cancers12051305. Cancers (Basel). 2020. PMID: 32455681 Free PMC article. - The Application of Brain Organoid Technology in Stroke Research: Challenges and Prospects.
Song G, Zhao M, Chen H, Zhou X, Lenahan C, Ou Y, He Y. Song G, et al. Front Cell Neurosci. 2021 Jun 21;15:646921. doi: 10.3389/fncel.2021.646921. eCollection 2021. Front Cell Neurosci. 2021. PMID: 34234646 Free PMC article. Review.
References
- Gjorevski N. & Nelson C. M. Integrated morphodynamic signalling of the mammary gland. Nat Rev Mol Cell Biol 12, 581–593 (2011). - PubMed
- Friedl P. et al. Migration of coordinated cell clusters in mesenchymal and epithelial cancer explants in vitro. Cancer Res 55, 4557–4560 (1995). - PubMed
- Friedl P. & Gilmour D. Collective cell migration in morphogenesis, regeneration and cancer. Nat Rev Mol Cell Biol 10, 445–457 (2009). - PubMed
- Khalil A. A. & Friedl P. Determinants of leader cells in collective cell migration. Integr Biol (Camb) 2, 568–574 (2010). - PubMed
Publication types
MeSH terms
Substances
Grants and funding
- R21 HL118532/HL/NHLBI NIH HHS/United States
- U54 CA143803/CA/NCI NIH HHS/United States
- HL1100335/HL/NHLBI NIH HHS/United States
- R01 GM083997/GM/NIGMS NIH HHS/United States
- R01 HL120142/HL/NHLBI NIH HHS/United States
- CA128660/CA/NCI NIH HHS/United States
- HL118532/HL/NHLBI NIH HHS/United States
- U54CA143803/CA/NCI NIH HHS/United States
- R21 CA128660/CA/NCI NIH HHS/United States
- GM083997/GM/NIGMS NIH HHS/United States
- HL120142/HL/NHLBI NIH HHS/United States
LinkOut - more resources
Full Text Sources
Other Literature Sources


