Targeted sequencing identifies associations between IL7R-JAK mutations and epigenetic modulators in T-cell acute lymphoblastic leukemia - PubMed (original) (raw)
. 2015 Oct;100(10):1301-10.
doi: 10.3324/haematol.2015.130179. Epub 2015 Jul 23.
Claire Schwab 2, Michaël Broux 1, Ellen Geerdens 1, Sandrine Degryse 1, Sofie Demeyer 1, Idoya Lahortiga 1, Alannah Elliott 2, Lucy Chilton 2, Roberta La Starza 3, Cristina Mecucci 3, Peter Vandenberghe 4, Nicholas Goulden 5, Ajay Vora 6, Anthony V Moorman 2, Jean Soulier 7, Christine J Harrison 8, Emmanuelle Clappier 9, Jan Cools 10
Affiliations
- PMID: 26206799
- PMCID: PMC4591762
- DOI: 10.3324/haematol.2015.130179
Targeted sequencing identifies associations between IL7R-JAK mutations and epigenetic modulators in T-cell acute lymphoblastic leukemia
Carmen Vicente et al. Haematologica. 2015 Oct.
Abstract
T-cell acute lymphoblastic leukemia is caused by the accumulation of multiple oncogenic lesions, including chromosomal rearrangements and mutations. To determine the frequency and co-occurrence of mutations in T-cell acute lymphoblastic leukemia, we performed targeted re-sequencing of 115 genes across 155 diagnostic samples (44 adult and 111 childhood cases). NOTCH1 and CDKN2A/B were mutated/deleted in more than half of the cases, while an additional 37 genes were mutated/deleted in 4% to 20% of cases. We found that IL7R-JAK pathway genes were mutated in 27.7% of cases, with JAK3 mutations being the most frequent event in this group. Copy number variations were also detected, including deletions of CREBBP or CTCF and duplication of MYB. FLT3 mutations were rare, but a novel extracellular mutation in FLT3 was detected and confirmed to be transforming. Furthermore, we identified complex patterns of pairwise associations, including a significant association between mutations in IL7R-JAK genes and epigenetic regulators (WT1, PRC2, PHF6). Our analyses showed that IL7R-JAK genetic lesions did not confer adverse prognosis in T-cell acute lymphoblastic leukemia cases enrolled in the UK ALL2003 trial. Overall, these results identify interconnections between the T-cell acute lymphoblastic leukemia genome and disease biology, and suggest a potential clinical application for JAK inhibitors in a significant proportion of patients with T-cell acute lymphoblastic leukemia.
Copyright© Ferrata Storti Foundation.
Figures
Figure 1.
Haloplex target enrichment analyses can be used to identify copy number variations. For MAGEC3, KDM6A, MYB and PTPN2 genes, the normalized coverage against the on-target mapped nucleotides is plotted for all patients on an arbitrary linear scale. In order to determine real copy number variations, for each gene we calculated the first quartile (Q1), third quartile (Q3) and the interquartile range (IQR= Q1 – Q3) from the normalized coverage values. Samples with a normalized coverage for a particular gene greater than Q3+1.5*IQR were considered to have a duplication/amplification in that gene. Conversely, samples with a normalized coverage less than Q1−1.5*IQR, were considered to carry a deletion. The calculated values for each gene are represented in the graphs as dotted lines. For X-chromosome genes, we did those calculations taking along only male or female samples. (A) Read depths for MAGEC3 are consistent with the patients’ gender (except case number TL91), with females showing an ~2-fold higher coverage than males. While no copy number variations were found in MAGEC3, there was evidence for deletion of KDM6A in case number 4139. (B) By using Haloplex we were able to confirm the presence of PTPN2 deletions in all (6/6) _PTPN2_-positive cases (shown as blue dots in the graphs). MYB duplications were confirmed in 64% (9/14) of _MYB_-positive cases (orange dots). Haloplex analyses predicted four additional cases carrying MYB duplication (purple dots), which were false positive results.
Figure 2.
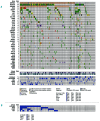
Overview of the genetic lesions identified in the most frequently mutated genes in T-ALL. (A) Single nucleotide variants, indels and copy number variations are shown for the 40 genes we found mutated in more than 4% of the cases in our series. Each type of mutation is indicated by a different color. Age, gender and T-ALL characteristics are also shown for each patient (bottom table). (B) Spectrum of genetic lesions in IL7R-JAK signaling members (IL7R, JAK3, JAK1 and STAT5 genes), PHF6, PRC2 complex members (SUZ12, EZH2 and EED) and WT1. The cases with PHF6, PRC2 and WT1 mutations were more frequently found among IL7R-JAK-positive cases.
Figure 3.
The spectrum of some of the identified genetic lesions closely correlated with patients’ characteristics and T-ALL subtypes. Associations between the most frequently mutated genes (top 40 genes, ranked from the most frequently targeted gene) and patients’ characteristics/T-ALL subtypes are shown. Associations with _P_-values lower than 0.05, 0.01 and 0.001 are indicated with circles of different sizes. Positive associations are shown in orange, negative associations are shown in blue. Associations that could not be considered as positive or negative are shown in gray. A = adult group, P = pediatric group, F = female group.
Figure 4.
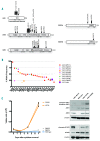
Overview of the identified mutations in the IL7R-JAK signaling pathway members. (A) Schematic view of the IL7R, JAK3, JAK1, STAT5A and STAT5B proteins and their main protein domains. The mutations found in each of those proteins are shown. (B) The variant allele frequencies for JAK3 mutations are shown in the graph. In eight out of the 23 cases carrying JAK3 mutations (case numbers indicated with asterisks), the M511I mutation was detected together with a second mutation of JAK3. (C) Proliferation curve of Ba/F3 cells expressing various JAK3 mutants or the empty vector, in the absence of cytokines. Mutations that did not stimulate proliferation more than the empty vector were considered as not transforming mutants. (D) Western blot analysis of whole cell lysates of Ba/F3 cells transformed by the JAK3 mutants V678L and E958K, or empty vector. A protein lysate of Ba/F3 cells transformed by the JAK3 M511I mutant (previously described as transforming) was included as a positive control. Phosphorylation of JAK1 and JAK3 was detected for all JAK3 mutants. JAK3 protein expression was detected with a human specific antibody, not recognizing the endogenous JAK3 expression. The transforming JAK3 mutants were able to phosphorylate STAT5.
Figure 5.
JAK3 mutations occur predominantly in the major clone at diagnosis. Variant allele frequencies of the mutated genes identified the 23 cases with JAK3 mutations. For the purpose of clarity, only those genes mutated in more than 4% of T-ALL cases are shown. JAK3 mutations are predominantly present in the major clone when two JAK3 mutations or JAK3 and JAK1 mutations occur together, while a minor has the second mutation.
Similar articles
- RNA sequencing unravels the genetics of refractory/relapsed T-cell acute lymphoblastic leukemia. Prognostic and therapeutic implications.
Gianfelici V, Chiaretti S, Demeyer S, Di Giacomo F, Messina M, La Starza R, Peragine N, Paoloni F, Geerdens E, Pierini V, Elia L, Mancini M, De Propris MS, Apicella V, Gaidano G, Testi AM, Vitale A, Vignetti M, Mecucci C, Guarini A, Cools J, Foà R. Gianfelici V, et al. Haematologica. 2016 Aug;101(8):941-50. doi: 10.3324/haematol.2015.139410. Epub 2016 May 5. Haematologica. 2016. PMID: 27151993 Free PMC article. - Oncogenic IL7R gain-of-function mutations in childhood T-cell acute lymphoblastic leukemia.
Zenatti PP, Ribeiro D, Li W, Zuurbier L, Silva MC, Paganin M, Tritapoe J, Hixon JA, Silveira AB, Cardoso BA, Sarmento LM, Correia N, Toribio ML, Kobarg J, Horstmann M, Pieters R, Brandalise SR, Ferrando AA, Meijerink JP, Durum SK, Yunes JA, Barata JT. Zenatti PP, et al. Nat Genet. 2011 Sep 4;43(10):932-9. doi: 10.1038/ng.924. Nat Genet. 2011. PMID: 21892159 Free PMC article. - IL7R overexpression in adult acute lymphoblastic leukemia is associated to JAK/STAT pathway mutations and identifies patients who could benefit from targeted therapies.
Gianfelici V, Messina M, Paoloni F, Peragine N, Lauretti A, Fedullo AL, Di Giacomo F, Vignetti M, Vitale A, Guarini A, Chiaretti S, Foà R. Gianfelici V, et al. Leuk Lymphoma. 2019 Mar;60(3):829-832. doi: 10.1080/10428194.2018.1499906. Epub 2018 Sep 6. Leuk Lymphoma. 2019. PMID: 30188230 No abstract available. - Deleterious point mutations in T-cell acute lymphoblastic leukemia: Mechanistic insights into leukemogenesis.
Roy U, Raghavan SC. Roy U, et al. Int J Cancer. 2021 Sep 15;149(6):1210-1220. doi: 10.1002/ijc.33527. Epub 2021 Mar 31. Int J Cancer. 2021. PMID: 33634864 Review. - Mutations that collaborate with IL-7Ra signaling pathways to drive ALL.
Rodrigues GOL, Cramer SD, Winer HY, Hixon JA, Li W, Yunes JA, Durum SK. Rodrigues GOL, et al. Adv Biol Regul. 2021 May;80:100788. doi: 10.1016/j.jbior.2021.100788. Epub 2021 Jan 21. Adv Biol Regul. 2021. PMID: 33578108 Review.
Cited by
- Recurrent somatic mutations and low germline predisposition mutations in Korean ALL patients.
Shin SY, Lee H, Lee ST, Choi JR, Jung CW, Koo HH, Kim SH. Shin SY, et al. Sci Rep. 2021 Apr 26;11(1):8893. doi: 10.1038/s41598-021-88449-4. Sci Rep. 2021. PMID: 33903686 Free PMC article. Clinical Trial. - Targeting dual oncogenic machineries driven by TAL1 and PI3K-AKT pathways in T-cell acute lymphoblastic leukemia.
Lim FQ, Chan AS, Yokomori R, Huang XZ, Theardy MS, Yeoh AEJ, Tan SH, Sanda T. Lim FQ, et al. Haematologica. 2023 Feb 1;108(2):367-381. doi: 10.3324/haematol.2022.280761. Haematologica. 2023. PMID: 36073513 Free PMC article. - Single-cell DNA amplicon sequencing reveals clonal heterogeneity and evolution in T-cell acute lymphoblastic leukemia.
Albertí-Servera L, Demeyer S, Govaerts I, Swings T, De Bie J, Gielen O, Brociner M, Michaux L, Maertens J, Uyttebroeck A, De Keersmaecker K, Boeckx N, Segers H, Cools J. Albertí-Servera L, et al. Blood. 2021 Feb 11;137(6):801-811. doi: 10.1182/blood.2020006996. Blood. 2021. PMID: 32812017 Free PMC article. - Pediatric T-ALL type-1 and type-2 relapses develop along distinct pathways of clonal evolution.
Richter-Pechańska P, Kunz JB, Rausch T, Erarslan-Uysal B, Bornhauser B, Frismantas V, Assenov Y, Zimmermann M, Happich M, von Knebel-Doeberitz C, von Neuhoff N, Köhler R, Stanulla M, Schrappe M, Cario G, Escherich G, Kirschner-Schwabe R, Eckert C, Avigad S, Pfister SM, Muckenthaler MU, Bourquin JP, Korbel JO, Kulozik AE. Richter-Pechańska P, et al. Leukemia. 2022 Jul;36(7):1759-1768. doi: 10.1038/s41375-022-01587-0. Epub 2022 May 18. Leukemia. 2022. PMID: 35585141 Free PMC article. - The Physiopathology of T- Cell Acute Lymphoblastic Leukemia: Focus on Molecular Aspects.
Fattizzo B, Rosa J, Giannotta JA, Baldini L, Fracchiolla NS. Fattizzo B, et al. Front Oncol. 2020 Feb 28;10:273. doi: 10.3389/fonc.2020.00273. eCollection 2020. Front Oncol. 2020. PMID: 32185137 Free PMC article. Review.
References
- Weng AP, Ferrando AA, Lee W, et al. Activating mutations of NOTCH1 in human T cell acute lymphoblastic leukemia. Science. 2004;306(5694):269–271. - PubMed
- Aifantis I, Raetz E, Buonamici S. Molecular pathogenesis of T-cell leukaemia and lymphoma. Nat Rev Immunol. 2008;8(5):380–390. - PubMed
- Hebert J, Cayuela JM, Berkeley J, Sigaux F. Candidate tumor-suppressor genes MTS1 (p16INK4A) and MTS2 (p15INK4B) display frequent homozygous deletions in primary cells from T- but not from B-cell lineage acute lymphoblastic leukemias. Blood. 1994;84(12):4038–4044. - PubMed
- Soulier J, Clappier E, Cayuela J-M, et al. HOXA genes are included in genetic and biologic networks defining human acute T-cell leukemia (T-ALL). Blood. 2005;106(1):274–286. - PubMed
Publication types
MeSH terms
Substances
LinkOut - more resources
Full Text Sources
Other Literature Sources
Miscellaneous


