Multiparametric Cell Cycle Analysis Using the Operetta High-Content Imager and Harmony Software with PhenoLOGIC - PubMed (original) (raw)
Multiparametric Cell Cycle Analysis Using the Operetta High-Content Imager and Harmony Software with PhenoLOGIC
Andrew J Massey. PLoS One. 2015.
Abstract
High-content imaging is a powerful tool for determining cell phenotypes at the single cell level. Characterising the effect of small molecules on cell cycle distribution is important for understanding their mechanism of action especially in oncology drug discovery but also for understanding potential toxicology liabilities. Here, a high-throughput phenotypic assay utilising the PerkinElmer Operetta high-content imager and Harmony software to determine cell cycle distribution is described. PhenoLOGIC, a machine learning algorithm within Harmony software was employed to robustly separate single cells from cell clumps. DNA content, EdU incorporation and pHH3 (S10) expression levels were subsequently utilised to separate cells into the various phases of the cell cycle. The assay is amenable to multiplexing with an additional pharmacodynamic marker to assess cell cycle changes within a specific cellular sub-population. Using this approach, the cell cycle distribution of γH2AX positive nuclei was determined following treatment with DNA damaging agents. Likewise, the assay can be multiplexed with Ki67 to determine the fraction of quiescent cells and with BrdU dual labelling to determine S-phase duration. This methodology therefore provides a relatively cheap, quick and high-throughput phenotypic method for determining accurate cell cycle distribution for small molecule mechanism of action and drug toxicity studies.
Conflict of interest statement
Competing Interests: AJM is an employee and stock option holder of Vernalis. This does not alter the author's adherence to PLOS ONE policies on sharing data and materials.
Figures
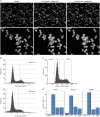
Fig 1. High-content cell cycle analysis based on DNA content.
(A) Example images of HT29 cells with nuclei stained with Hoechst 33342 and then segmented with Harmony software using Find Nuclei Method B or Method M. Arrows indicate examples of incompletely segmented nuclei. (B) DNA content histograms of Hoechst 33342 stained HT29 cells, prior to application of the PhenoLOGIC algorithm, using Find Nuclei method B and M. Red dotted lines indicate the position of the G1 and G2 peak. (C) DNA content histograms obtained from HT29 cells showing gating to identify cell cycle distribution. (D) Cell cycle distribution for asynchronous HT29, SKOV-3 and U87MG cells determined from DNA content histograms. Values are the average of 8 technical replicates ± SD.
Fig 2. Multiparametric analysis of cell cycle distribution.
(A) Example images demonstrating DNA staining with Hoechst 33342, EdU incorporation and pHH3 (S10) expression in untreated HT29 cells. (B) Plots of DNA content versus log EdU content and DNA content versus log mean pHH3 (S10) expression to determine the major cell cycle phases in asynchronous HT29 cells. (C) Cell cycle distribution for asynchronous HT29, SKOV-3 and U87MG cells determined from multiparametric high-content images. Values are the average of 8 technical replicates ± SD.
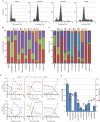
Fig 3. Validation of image analysis protocol.
HT29 cells were treated with the indicated compound for 24 hour and then fixed and stained with Hoechst 33342, EdU and pHH3 (S10). (A) Example histograms following treatment with DMSO, etoposide, paclitaxel or VX680. Cell cycle distribution was determined using either DNA histogram analysis (B) or multiparametric analysis (C). (D) Time course and dose response of cell cycle changes determined using the multiparametric method for cells treated with camptothecin, gemcitabine or etoposide. (E) Proliferation index (EdU positive cells treated / EdU positive cells control) and cell number were determined from the images. Values are the average of 6 technical replicates.
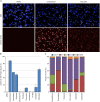
Fig 4. Determination of cell cycle phase of γH2AX positive cells following treatment with a cytotoxic DNA damaging agent.
HT29 cells were treated with the indicated compound for 24 hour and then fixed and stained with Hoechst 33342, EdU, pHH3 (S10) and pH2AX (S139). (A) Example images from HT29 cells treated with DMSO, camptothecin or etoposide demonstrating the presence of pH2AX (S139) positive (γH2AX) nuclei. (B) Quantification of the fraction of γH2AX positive nuclei following treatment with the various agents. (C) Cell cycle distribution of γH2AX positive nuclei following multiparametric analysis. Values are the average of 6 technical replicates ± SD.
Fig 5. Estimation of S-phase Duration using EdU-BrdU Dual Pulse Labelling.
(A) Images of HT29 cells labelled with various combinations of EdU and BrdU demonstrating the selectivity of Click-iT chemistry for EdU and MoBU-1 antibody for BrdU. (B) Percentage of cells labelled with the various combinations of EdU and BrdU. Values are the average of 6 replicates ± SD. (C) Dot plot of Mean Nuclear EdU versus Mean Nuclear BrdU demonstrating the positioning of gates for the various cell populations.
Fig 6. Determination of cellular quiescence using nuclear RNA staining.
HT29 cells growing in 10% FCS or in 0.2% FCS for 72 hours were fixed and stained with Pyronin Y or RNAselect for determination of RNA and total DNA content. Plots of total nuclear DNA content versus total nuclear RNA content.
Fig 7. Determination of cellular quiescence using nuclear Ki67 expression levels.
HT29 cells growing in 10% FCS or in 0.2% FCS for 72 hours were fixed and stained for Ki67 and pHH3 (S10) expression, total EdU and total DNA content. (A) Example images demonstrating Ki67 staining in HT29 cells. (B) Plots of total DNA versus log mean Ki67 fluorescence intensity demonstrating the identification of the quiescent (Ki67 negative) cell population. (C) Cell cycle distribution of HT29 and U87MG cells grown in 10% or 0.2% FCS determined from multiparametric high-content images. Values are the average of 8 technical replicates ± SD.
Similar articles
- Multiparametric cell cycle analysis by automated microscopy.
Gasparri F, Cappella P, Galvani A. Gasparri F, et al. J Biomol Screen. 2006 Sep;11(6):586-98. doi: 10.1177/1087057106289406. Epub 2006 Jul 14. J Biomol Screen. 2006. PMID: 16844964 - Analysis of cell cycle by flow cytometry.
Pozarowski P, Darzynkiewicz Z. Pozarowski P, et al. Methods Mol Biol. 2004;281:301-11. doi: 10.1385/1-59259-811-0:301. Methods Mol Biol. 2004. PMID: 15220539 - A method to estimate cell cycle time and growth fraction using bromodeoxyuridine-flow cytometry data from a single sample.
Eidukevicius R, Characiejus D, Janavicius R, Kazlauskaite N, Pasukoniene V, Mauricas M, Den Otter W. Eidukevicius R, et al. BMC Cancer. 2005 Sep 22;5:122. doi: 10.1186/1471-2407-5-122. BMC Cancer. 2005. PMID: 16176590 Free PMC article. - DNA measurement and cell cycle analysis by flow cytometry.
Nunez R. Nunez R. Curr Issues Mol Biol. 2001 Jul;3(3):67-70. Curr Issues Mol Biol. 2001. PMID: 11488413 Review. - [Application of bromodeoxyuridine (BrdU) and anti-BrdU monoclonal antibody for the analysis of tumor cell kinetics by flow cytometry].
Kanno M, Takeda Y, Nakamura S. Kanno M, et al. Nihon Rinsho. 1992 Oct;50(10):2333-7. Nihon Rinsho. 1992. PMID: 1280304 Review. Japanese.
Cited by
- Markers of tumor-associated macrophages and microglia exhibit high intratumoral heterogeneity in human glioblastoma tissue.
Ispirjan M, Marx S, Freund E, Fleck SK, Baldauf J, Roessler K, Schroeder HWS, Bekeschus S. Ispirjan M, et al. Oncoimmunology. 2024 Dec 31;13(1):2425124. doi: 10.1080/2162402X.2024.2425124. Epub 2024 Nov 10. Oncoimmunology. 2024. PMID: 39523551 Free PMC article. - Intramammary Labeling of Epithelial Cell Division.
Machiela MN, Hovey RC. Machiela MN, et al. J Mammary Gland Biol Neoplasia. 2024 Oct 16;29(1):17. doi: 10.1007/s10911-024-09570-4. J Mammary Gland Biol Neoplasia. 2024. PMID: 39412532 Free PMC article. - Trichomonas vaginalis extracellular vesicles up-regulate and directly transfer adherence factors promoting host cell colonization.
Kochanowsky JA, Mira PM, Elikaee S, Muratore K, Rai AK, Riestra AM, Johnson PJ. Kochanowsky JA, et al. Proc Natl Acad Sci U S A. 2024 Jun 18;121(25):e2401159121. doi: 10.1073/pnas.2401159121. Epub 2024 Jun 12. Proc Natl Acad Sci U S A. 2024. PMID: 38865261 Free PMC article. - The RNA binding proteins LARP4A and LARP4B promote sarcoma and carcinoma growth and metastasis.
Coleman JC, Tattersall L, Yianni V, Knight L, Yu H, Hallett SR, Johnson P, Caetano AJ, Cosstick C, Ridley AJ, Gartland A, Conte MR, Grigoriadis AE. Coleman JC, et al. iScience. 2024 Feb 24;27(4):109288. doi: 10.1016/j.isci.2024.109288. eCollection 2024 Apr 19. iScience. 2024. PMID: 38532886 Free PMC article. - Exploring the role of macrophages in the progression from atypical hyperplasia to endometrial carcinoma through single-cell transcriptomics and bulk transcriptomics analysis.
Song X, Na R, Peng N, Cao W, Ke Y. Song X, et al. Front Endocrinol (Lausanne). 2023 Sep 14;14:1198944. doi: 10.3389/fendo.2023.1198944. eCollection 2023. Front Endocrinol (Lausanne). 2023. PMID: 37780629 Free PMC article.
References
- Shapiro HM. Practical Flow Cytometry. 4th ed 2003.
- Ormerod MG. Flow cytometry. 3rd ed 2000.
- Pozarowski P, Darzynkiewicz Z. Analysis of cell cycle by flow cytometry. Methods Mol Biol 2004; 281: 301–311. - PubMed
- Hang H, Fox MH. Analysis of the mammalian cell cycle by flow cytometry. Methods Mol Biol 2004; 241: 23–35. - PubMed
Publication types
MeSH terms
Substances
Grants and funding
This work was funded by Vernalis Research who agreed to the publication of this manuscript. The funder provided support in the form of salaries for author AJM, but did not have any additional role in the study design, data collection and analysis, decision to publish, or preparation of the manuscript. The specific role of the author are articulated in the ‘author contributions’ section.
LinkOut - more resources
Full Text Sources
Other Literature Sources
Miscellaneous


