Circuit Architecture of VTA Dopamine Neurons Revealed by Systematic Input-Output Mapping - PubMed (original) (raw)
Circuit Architecture of VTA Dopamine Neurons Revealed by Systematic Input-Output Mapping
Kevin T Beier et al. Cell. 2015.
Abstract
Dopamine (DA) neurons in the midbrain ventral tegmental area (VTA) integrate complex inputs to encode multiple signals that influence motivated behaviors via diverse projections. Here, we combine axon-initiated viral transduction with rabies-mediated trans-synaptic tracing and Cre-based cell-type-specific targeting to systematically map input-output relationships of VTA-DA neurons. We found that VTA-DA (and VTA-GABA) neurons receive excitatory, inhibitory, and modulatory input from diverse sources. VTA-DA neurons projecting to different forebrain regions exhibit specific biases in their input selection. VTA-DA neurons projecting to lateral and medial nucleus accumbens innervate largely non-overlapping striatal targets, with the latter also sending extensive extra-striatal axon collaterals. Using electrophysiology and behavior, we validated new circuits identified in our tracing studies, including a previously unappreciated top-down reinforcing circuit from anterior cortex to lateral nucleus accumbens via VTA-DA neurons. This study highlights the utility of our viral-genetic tracing strategies to elucidate the complex neural substrates that underlie motivated behaviors.
Copyright © 2015 Elsevier Inc. All rights reserved.
Figures
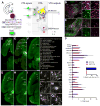
Figure 1. Rabies-mediated Transsynaptic Tracing Reveals Inputs to VTA Dopamine (DA) and GABA Neurons
(A) Schematic of rabies tracing, shown for DAT-Cre. Left, diagrams of the injection site (blue box highlights VTA) and the viruses used. (1) Injections of AAVs expressing Cre-dependent TVA-mCherry (TC) and rabies glycoprotein (G) were targeted unilaterally to the VTA. (2) Two weeks later, EnvA-pseudotyped, G-deleted, GFP-expressing rabies virus (RV_dG_) was injected into the same VTA site. (3) Five days were allowed for rabies to transduce and label synaptically-connected input neurons. (B–C) In the VTA (between the dotted lines), most TC-expressing cells initiated in DAT-Cre mice co-stained with the anti-tyrosine hydroxylase (TH) antibody (B), while TC-labeled cells in GAD2-Cre animals did not (C). In the insets, arrows indicate TC-expressing cells. Green, GFP from RV_dG_; red, TC; magenta, TH immunoreactivity. Scale, 200 μm (100 μm for inset). (D–I) Horizontal section series showing brain-wide distribution of input to VTA-DA neurons. Scale, 1 mm. (J–O) High-magnification images of rabies-infected input neurons, including principal neurons in the cortex and striatal projection neurons in the NAcCore (yellow arrowheads). Scale, 100 μm. (P) Quantification of inputs to VTA-DA or VTA-GABA neurons from DAT-Cre or GAD2-Cre mice, respectively. Data are shown as percent of inputs from a given region relative to total counted inputs throughout a given brain. While overall inputs to DA and GABA neurons are significantly different (p<0.01, Fisher’s combined probability test), no individual input showed a significant preference for DA or GABA neurons (p>0.05 for all inputs, t-test with Holm-Sidak correction for multiple comparisons). Inset, 95% of starter cells in the VTA of DAT-Cre mice are TH+, while 4% in GAD2-Cre animals are TH+; n=4 for each condition. In this and all subsequent figures, error bars represent s.e.m. See also Figure S1, S2, S4, S5, and Table S1–S3 for related data.
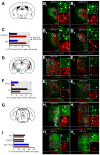
Figure 2. VTA-DA and VTA-GABA Neurons Receive Synaptic Inputs from Diverse Cell Types
(A) Coronal schematic showing the paraventricular hypothalamus (PVH, blue) where inputs to VTA-DA and -GABA neurons were examined for expression of the mRNAs encoding either oxytocin (B1, B3) or arginine vasopressin (AVP; B2, B4) precursors. (B) Overlap of in situ hybridization (ISH) signals (red) with GFP from RV_dG_ (green) was observed for inputs to both VTA-DA (B1-B2) and VTA-GABA (B3-B4) neurons. Arrowheads indicate cells co-labeled with ISH probe and GFP. (C) Quantification of percentage of total rabies-labeled inputs in the PVH that co-stained with ISH probe. Both oxytocin+ (p<0.001, t-test) and AVP+ (p=0.02) neurons showed a preference for sending input to VTA-GABA neurons. n=6 (mice) for both probes in DAT-Cre, and n=5 for both probes in GAD2-Cre. (D–F) ISH in the lateral hypothalamus (LH) for genes encoding orexin (hypocretin) or neurotensin (NT), analogous to panels A–C. (F) Both orexin neurons (p=0.0143) and NT neurons (p=0.03) showed a preference for VTA-DA neurons. n=4 for all. (G–I) ISH in the dorsal raphe (DR) for genes encoding Tph2, GAD1/2, VGluT1/2/3, and TH, in DAT-Cre mice. No TH+/GFP+ neurons were observed. (I) Serotonin (p=0.27), GABA (p=0.97), and glutamate (p=0.84) neurons did not show a preference for VTA-DA or VTA-GABA neurons. n=4 for all. The combined fraction exceeded 100% because a large fraction of neurons were both vGluT3+ and Tph2+. All statistics were t-tests. p-values were obtained with Holm-Sidak correction for multiple comparisons where applicable. Scale, 100 μm.
Figure 3. cTRIO Analysis of the Input–Output Relationships of VTA-DA Neurons
(A–B) Schematic of cTRIO experiments. (1) CAV-FLExloxP-Flp was injected into one of four output sites (coronal schematics in B). (2) On the same day, AAVs that express Flp-dependent TC and G were injected into the VTA. (3) Two weeks later, RV_d_G was injected into the VTA. (4) Five days later, histological analyses were performed. (C) Average starter cell distributions at the VTA for four cTRIO conditions. The center of each oval represents the center of mass for starter cells, and the horizontal and vertical radii of the oval represent one standard deviation of starter cells in the medial–lateral and dorsal–ventral axes, respectively. See Figure S4 for more details. (D) Percentage of starter cells that co-label with TH for each cTRIO condition. (E) Whole-brain input data to each of the VTA neuronal populations defined by cTRIO (n=4 for each condition). Percentage of total inputs is plotted on the x-axis, and brain region on the y-axis. Brain regions with significant differences (p<0.05, 1-way ANOVA for each brain region, with Holm-Sidak correction for 22 1-way ANOVAs) are highlighted in gray. *: NAcLatS, NAcCore, and DR send significantly different fractional input to NAcLat compared to NAcMed, mPFC, and Amy (p<0.05, post-hoc pairwise comparisons with Holm-Sidak corrections for 6 comparisons). Because NAcLat-projecting VTA-DA neurons produce the most inputs (Table S1), the input distribution from NAcLat-based cTRIO resembles Figure 1P the most. See Figure 1 for abbreviation of anatomical regions, Figure S2–S4 and Table S1–S3 for related data.
Figure 4. Axonal Arborization Analysis of NAcLat- and NAcMed-projecting VTA-DA Neurons
(A) Schematic of experimental setup. (1) CAV-FLExloxP-Flp was injected into either the NAcLat or NAcMed. (2) On the same day, an AAV expressing Flp-dependent membrane-GFP was injected into the VTA. Brains were harvested two months later. (B) Representative coronal sections showing axonal projections of NAcMed-projecting (middle) and NAcLat-projecting (right) VTA-DA neurons in the striatum, along with the atlas schematic (left). Dotted lines outline subdivisions of the striatum. DLS, dorsolateral striatum; DMS, dorsomedial striatum. (C) Same as in (B) except more posterior coronal sections are shown. Dotted lines outline the BNST. (D) Proportion of total arborization of NAcMed- and NAcLat-projecting VTA-DA neurons across 10 brain regions. An average of 349±80 VTA-DA neurons were labeled by targeting NAcMed (n=5), and 366±106 neurons by NAcLat (n=4). (E) NAcLat-projecting DA neurons showed a broader arborization than NAcMed-projecting DA neurons, as evidenced by a greater area covered by labeled axonal arbors. Scale, 500 μm.
Figure 5. Electrophysiological Validation of New Pathways Identified using cTRIO
(A) Schematic of experimental setup. An AAV expressing ChR2-eYFP was injected into the lateral habenula (LHb), medial prefrontal cortex (mPFC), or anterior cortex (depicted), red retrobeads were injected into NAcLat, and AAV-CMV-FLExloxP-GFP into the VTA of a DAT-Cre mouse. Two months later, whole-cell recordings were conducted from GFP+ retrobeads+ neurons in acute VTA slices while photostimulating ChR2-expressing axons and terminals. (B) Map of responding (green) and non-responding (red) cells to photostimulation. (C) Sample excitatory postsynaptic currents (EPSCs) from identified VTA-DA neurons receiving inputs from the LHb, mPFC, or anterior cortex. (D) Quantification of connectivity from each input site. (E) Average EPSC amplitudes from responding cells at –60 mV in each experiment. Colored shapes and black bars indicate individual values and the means, respectively. See Figure S5 for related data.
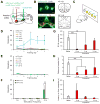
Figure 6. Behavioral Function of the Anterior Cortex→VTA-DA→NAcLat Circuit
(A) Schematic of experimental setup. An AAV expressing either ChR2-eYFP or eYFP was injected into the anterior cortex (medial and lateral sites) and optical fibers were implanted above the VTA so that anterior cortex axon terminals innervating the VTA could be optically stimulated. A guide cannula was also implanted targeting the NAcLat in all mice for drug delivery in some experiments. All manipulations were bilateral. (B) Top, ChR2-eYFP expression following virus injection into anterior cortex. Scale, 1 mm. Bottom, ChR2-eYFP-expressing axon terminals in the VTA of the same mouse. Blue lines indicate optical fiber tips. Scale, 100 μm. (C) Schematic of ICSS task. Mice were allowed to respond freely at 5 nosepoke ports for 1 hr per day over 5 training days. A response at 4 ports resulted in the delivery of a 2s train of light pulses at varying frequencies (1, 5, 10, 20 Hz); an LED in the back of the port was concurrently illuminated to serve as a visual cue indicating ongoing stimulation. Responses at a 5th control port (0 Hz) had no consequence. For the first training session, all nosepokes were baited to facilitate initial investigation. (D) Mice expressing ChR2-eYFP (n=7) developed a strong preference for the 20 Hz port as compared to the 0 Hz control port (1-way Friedman repeated-measures ANOVA on ranks, main effect of nosepoke type p<0.006 on days 3–5; 20 Hz vs 0 Hz p<0.05, Tukey post-hoc tests). (E) Mice expressing eYFP (n=8) responded at similarly low levels at all nosepoke ports (p>0.351, days 1–5). (F) On training day 5, ChR2-eYFP mice made significantly more nosepokes at the 20 Hz port than eYFP mice (Mann-Whitney Rank-Sum test with Bonferroni correction, p=0.005), indicating that optical activation of the anterior cortex-VTA projection is reinforcing. (G–I) Infusion of the non-selective dopamine receptor antagonist flupenthixol into the NAcLat dose-dependently decreased responding for 20 Hz stimulation of anterior cortex→VTA projections in ChR2-eYFP-expressing mice (n=5) (G; 1-way repeated-measures ANOVA, main effect of drug p<0.001; 10 Ag and 5 Ag flupenthixol vs. saline vehicle p<0.001 and p=0.01 respectively, Holm-Sidak post-hoc tests). Doses indicate amount of drug delivered per hemisphere in 0.25 μl saline. While locomotion was also concurrently decreased by flupenthixol (H; 1-way repeated-measures ANOVA, main effect of drug p<0.001; 10 μg, 5 μg and 2.5 μg flupenthixol vs. saline vehicle, p<0.001, p<0.001 and p=0.003 respectively, Holm-Sidak post-hoc tests) (H), the latency to make the first response was unaffected (I; p=0.482), indicating that mice were physically capable of performing nosepoke responses during behavioral sessions where flupenthixol was administered. See Figure S6 for related data.
Comment in
- Vive la difference! Dissecting the diversity of midbrain dopamine neurons.
Blesa J. Blesa J. Mov Disord. 2016 Jan;31(1):41. doi: 10.1002/mds.26487. Epub 2015 Dec 21. Mov Disord. 2016. PMID: 26686701 No abstract available.
Similar articles
- Oxytocin receptors are expressed on dopamine and glutamate neurons in the mouse ventral tegmental area that project to nucleus accumbens and other mesolimbic targets.
Peris J, MacFadyen K, Smith JA, de Kloet AD, Wang L, Krause EG. Peris J, et al. J Comp Neurol. 2017 Apr 1;525(5):1094-1108. doi: 10.1002/cne.24116. Epub 2016 Sep 27. J Comp Neurol. 2017. PMID: 27615433 Free PMC article. - Cholinergic axons in the rat ventral tegmental area synapse preferentially onto mesoaccumbens dopamine neurons.
Omelchenko N, Sesack SR. Omelchenko N, et al. J Comp Neurol. 2006 Feb 20;494(6):863-75. doi: 10.1002/cne.20852. J Comp Neurol. 2006. PMID: 16385486 Free PMC article. - Differential involvement of ventral tegmental GABA(A) and GABA(B) receptors in the regulation of the nucleus accumbens dopamine response to stress.
Doherty M, Gratton A. Doherty M, et al. Brain Res. 2007 May 30;1150:62-8. doi: 10.1016/j.brainres.2007.02.081. Epub 2007 Mar 6. Brain Res. 2007. PMID: 17395162 - Multiplexed neurochemical signaling by neurons of the ventral tegmental area.
Barker DJ, Root DH, Zhang S, Morales M. Barker DJ, et al. J Chem Neuroanat. 2016 Apr;73:33-42. doi: 10.1016/j.jchemneu.2015.12.016. Epub 2016 Jan 4. J Chem Neuroanat. 2016. PMID: 26763116 Free PMC article. Review. - The heterogeneity of ventral tegmental area neurons: Projection functions in a mood-related context.
Walsh JJ, Han MH. Walsh JJ, et al. Neuroscience. 2014 Dec 12;282:101-8. doi: 10.1016/j.neuroscience.2014.06.006. Epub 2014 Jun 12. Neuroscience. 2014. PMID: 24931766 Free PMC article. Review.
Cited by
- Neuronal basis of high frequency fMRI fluctuation: direct evidence from simultaneous recording.
Qiao Y, Lu H, Yang Y, Zang Y. Qiao Y, et al. Front Hum Neurosci. 2024 Oct 31;18:1501310. doi: 10.3389/fnhum.2024.1501310. eCollection 2024. Front Hum Neurosci. 2024. PMID: 39545149 Free PMC article. - The Cerebellum-Ventral Tegmental Area Microcircuit and Its Implications for Autism Spectrum Disorder: A Narrative Review.
Zhou P, Peng S, Wen S, Lan Q, Zhuang Y, Li X, Shi M, Zhang C. Zhou P, et al. Neuropsychiatr Dis Treat. 2024 Oct 29;20:2039-2048. doi: 10.2147/NDT.S485487. eCollection 2024. Neuropsychiatr Dis Treat. 2024. PMID: 39494383 Free PMC article. Review. - Transformation of valence signaling in a mouse striatopallidal circuit.
Lee D, Lau N, Liu L, Root CM. Lee D, et al. Elife. 2024 Oct 30;12:RP90976. doi: 10.7554/eLife.90976. Elife. 2024. PMID: 39475384 Free PMC article. - Transient nicotine exposure in early adolescent male mice freezes their dopamine circuits in an immature state.
Reynolds LM, Gulmez A, Fayad SL, Campos RC, Rigoni D, Nguyen C, Le Borgne T, Topilko T, Rajot D, Franco C, Fernandez SP, Marti F, Heck N, Mourot A, Renier N, Barik J, Faure P. Reynolds LM, et al. Nat Commun. 2024 Oct 18;15(1):9017. doi: 10.1038/s41467-024-53327-w. Nat Commun. 2024. PMID: 39424848 Free PMC article. - Dopamine dynamics in nucleus accumbens across reward-based learning of goal-directed whisker-to-lick sensorimotor transformations in mice.
Huang J, Crochet S, Sandi C, Petersen CCH. Huang J, et al. Heliyon. 2024 Sep 11;10(18):e37831. doi: 10.1016/j.heliyon.2024.e37831. eCollection 2024 Sep 30. Heliyon. 2024. PMID: 39323852 Free PMC article.
References
- Bäckman CM, Malik N, Zhang Y, Shan L, Grinberg A, Hoffer BJ, Westphal H, Tomac AC. Characterization of a mouse strain expressing Cre recombinase from the 3′ untranslated region of the dopamine transporter locus. Genesis. 2006;44:383–390. - PubMed
- Beckstead RM, Domesick VB, Nauta WJ. Efferent connections of the substantia nigra and ventral tegmental area in the rat. Brain Res. 1979;175:191–217. - PubMed
Publication types
MeSH terms
Substances
Grants and funding
- 1F32DA038913-01/DA/NIDA NIH HHS/United States
- F32 DA038913/DA/NIDA NIH HHS/United States
- P01 DA008227/DA/NIDA NIH HHS/United States
- R01 MH099647/MH/NIMH NIH HHS/United States
- P50 MH086403/MH/NIMH NIH HHS/United States
- TR01MH099647/MH/NIMH NIH HHS/United States
LinkOut - more resources
Full Text Sources
Other Literature Sources
Molecular Biology Databases
Research Materials


