Intact-Brain Analyses Reveal Distinct Information Carried by SNc Dopamine Subcircuits - PubMed (original) (raw)
Intact-Brain Analyses Reveal Distinct Information Carried by SNc Dopamine Subcircuits
Talia N Lerner et al. Cell. 2015.
Abstract
Recent progress in understanding the diversity of midbrain dopamine neurons has highlighted the importance--and the challenges--of defining mammalian neuronal cell types. Although neurons may be best categorized using inclusive criteria spanning biophysical properties, wiring of inputs, wiring of outputs, and activity during behavior, linking all of these measurements to cell types within the intact brains of living mammals has been difficult. Here, using an array of intact-brain circuit interrogation tools, including CLARITY, COLM, optogenetics, viral tracing, and fiber photometry, we explore the diversity of dopamine neurons within the substantia nigra pars compacta (SNc). We identify two parallel nigrostriatal dopamine neuron subpopulations differing in biophysical properties, input wiring, output wiring to dorsomedial striatum (DMS) versus dorsolateral striatum (DLS), and natural activity patterns during free behavior. Our results reveal independently operating nigrostriatal information streams, with implications for understanding the logic of dopaminergic feedback circuits and the diversity of mammalian neuronal cell types.
Copyright © 2015 Elsevier Inc. All rights reserved.
Figures
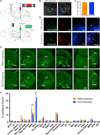
Figure 1. Whole-Brain Mapping of Inputs to DMS-Projecting and DLS-Projecting SNc DA Neurons
(A) Viral injection strategy for whole-brain input mapping (TRIO). CAV-cre is injected into the striatum (DMS or DLS), and AAVs expressing cre-dependent TC and G are injected into the SNc. Two weeks later, RV_dG_-GFP is injected into the SNc, where it infects TC-expressing cells and spreads one synapse upstream from G-expressing cells. (B) Low-magnification (5×) images of DMS- and DLS-projecting SNc “starter cells,” from which tracing likely occurred. Green shows RV_dG_-GFP expression, red shows TC expression, and blue shows (TH) immunostaining. (C) Quantification of the percentage of starter cells that were TH+. Error bars are SEM. (D) High-magnification (40×) images from the sections shown in (B). (E) Examples of GFP labeling of ipsilateral inputs to DMS- and DLS-projecting SNc DA neurons from various brain regions. S1, somatosensory cortex; NAc, nucleus accumbens; DS, dorsal striatum; BNST, bed nucleus of the stria terminalis; GPe, globus pallidus external segment; HY, hypothalamus; CeA, central amygdala; LHb, lateral habenula; DR, dorsal raphe; MRN, medial raphe nucleus; PAG, periaqueductal gray. (F) Quantification of ipsilaterally labeled inputs to DMS- and DLS-projecting SNc DA neurons, shown as a percentage of all ipsilateral inputs. Error bars are SEM. ***p < 0.001 and ****p < 0.0001. Other abbreviations: motor cortex (M1/2), somatosensory cortex (S1), fundus of the striatum/interstitial nucleus of the posterior limb of the anterior commissure (FS/IPAC), substantia innominata/ventral pallidum (SI/VP), superior colliculus (SC), inferior colliculus (IC), substantia nigra pars compacta (SNc), substantia nigra pars reticulata (SNr), ventral tegmental area (VTA), pedunculopontine nucleus (PPN), and parabrachial nucleus (PB). See also Figure S1 and Table S1.
Figure 2. Medial-Lateral Distribution of SNc DA Neurons Projecting to Medial and Lateral Subregions of Dorsal Striatum
(A) CAV-cre was injected into the striatum of Ai9 td-Tomato cre reporter mice, labeling SNc neurons projecting to the injected region in red. (B) DMS- and DLS-projecting SNc neurons are labeled with td-Tomato (red). Blue shows TH+ neurons. Both DMS- and DLS-projecting SNc neurons were found to be predominantly DAergic. Scale bars are 0.5 mm. (C) To map the outputs of DMS- and DLS-projecting SNc DA neurons, CAV-cre was injected into the striatum (DMS or DLS) of wild-type mice. Cre was then used to drive expression of mGFP-T2A–SYP-mRuby, labeling processes in green and presynaptic sites in red. (D) DMS- and DLS-projecting SNc DA neurons expressing mGFP and SYP-mRuby. Staining for TH (blue) shows overlap with DA neuron cell bodies. Scale bars are 0.5 mm. (E) Example images (53) of patterns of mGFP expression in the striatal projections of DMS- or DLS-projecting DA neurons. Ctx, cortex; Str, striatum; V, ventricle. (F) Example images (403) of regions of interest (DMS, DLS) in mice expressing mGFP and SYP-mRuby in DMS- and DLS-projecting SNc DA neurons. Scale bars are 50 µm. (G) Projection fraction of DMS- and DLS-projecting SNc DA neurons in DMS and DLS. Error bars are SEM. ****p < 0.0001. See also Figure S2.
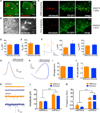
Figure 3. Intrinsic Properties of DMS-Projecting and DLS-Projecting SNc DA Neurons
(A) Retrobeads (red) injected into the striatum of TH::GFP mice. Ctx, cortex; Str, striatum. Scale bars are 0.5 mm. (B) DIC and red fluorescent images of a patched retrobead-containing neuron. Dotted lines highlight the position of the recording electrode. Scale bars are 10 µm. (C) Colocalization of retrobead-containing neurons (red) with TH-GFP-labeled neurons (green) in the SNc. Colocalization rates were ~99% and ~97% in DMS-and DLS-projecting neurons, respectively. (D) Membrane capacitance (Cm) of DMS- and DLS-projecting SNc DA neurons. Error bars are SEM. (E) Membrane resistance (Rm) of DMS- and DLS-projecting SNc DA neurons. Error bars are SEM. (F) Left, example responses of DMS-projecting SNc neurons (orange) and DLS-projecting SNc neurons (blue) to a hyperpolarizing current injection. Right, Ih and Ileak current measurements in response to hyperpolarizing current injection from DMS- and DLS-projecting SNc DA neurons. Error bars are SEM. **p < 0.01. (G) Average action potential waveforms from DMS- and DLS-projecting SNc DA neurons. Area of light shading is SEM. (H) Phase plots of average action potential waveforms from DMS- and DLS-projecting SNc DA neurons. Area of light shading is SEM. (I) Average action potential height from DMS- and DLS-projecting SNc DA neurons. Error bars are SEM. (J) Average action potential half widths from DMS- and DLS-projecting SNc DA neurons. Error bars are SEM. *p < 0.05. (K) Example traces of excitatory (top) and inhibitory (bottom) miniature postsynaptic currents from DMS-projecting (orange) and DLS-projecting (blue) SNc DA neurons. (L) Amplitudes of mEPSCs and mIPSCs recorded from DMS-projecting and DLS-projecting SNc DA neurons. Error bars are SEM. ****p < 0.0001. (M) Frequencies of mEPSCs and mIPSCs from recorded DMS-projecting and DLS-projecting SNc DA neurons. Error bars are SEM. ****p < 0.0001. See also Figure S3.
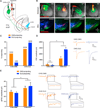
Figure 4. Optogenetic Mapping of Dorsal Striatal Inputs to DMS- and DLS-Projecting SNc DA Neurons: Reciprocal Connectivity Bias and Divergent Strength
(A) ChR2-eYFP was expressed in either the DMS or the DLS. Red retrobeads labeled inputs to either the DMS or the DLS. Retrobead-containing cells in the SNc were patched, and blue light was flashed to activate ChR2-expressing terminals nearby. Responses were recorded in the presence of TTX (1 µM) and 4-AP (100 µM) to isolate monosynaptic inputs. (B) Example images of striatal injection sites in the four experimental groups (top row) and of retrobead and ChR2expression in the SNc (bottom row). Blue shows TH immunostaining. Images are of slices used for recordings. Scale bars are 0.5 mm. (C) Percentage of patched neurons responding to ChR2 stimulation of striatal terminals in the four experimental groups. (D) IPSC amplitudes of responding neurons from (C). Example traces from each group are shown on the right. The blue bar indicates the time of blue light stimulation. Error bars are SEM. **p < 0.01 and ****p < 0.0001. (E) Quantification of the quantal IPSC (qIPSC) amplitude observed in DMS- and DLS-projecting SNc DA neurons in response to stimulation of DMS or DLS ChR2-expressing terminals. Example traces of evoked asynchronous IPSCs are shown on the right, with the period of qIPSC event collection highlighted in a pop out box. The blue bar indicates the time of stimulation. Error bars are SEM. *p < 0.05.
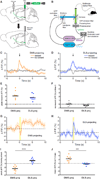
Figure 5. DMS- and DLS-Projecting SNc DA Neurons Respond Similarly to Appetitive but Differentially to Aversive Stimulation
(A) CAV-cre was injected into either the DMS or DLS. AAV-expressing cre-dependent GCaMP6f was injected into the SNc. A 400 µm fiber optic implant was placed in the SNc to allow for measurement of GCaMP6f signals. (B) Fiber photometry rig schematic. See Experimental Procedures for a more detailed description. (C) Example of responses to reward observed in a mouse expressing GCaMP6f in DMS-projecting SNc DA neurons. Time 0 is aligned to either rewarded or non-rewarded port entries in an operant chamber. Arrow is placed at time 0. Area of light shading is SEM. (D) Example of responses to reward observed in a mouse expressing GCaMP6f in DLS-projecting SNc DA neurons. (E) Quantification of the peak ΔF/F observed in response to reward in mice expressing GCaMP6f in DMS-projecting SNc DA neurons or in mice expressing GCaMP6f in DLS-projecting SNc DA neurons. (F) Quantification of the ΔF/F observed at time 0 in response to a non-rewarded port entry in mice expressing GCaMP6f in DMS-projecting SNc DA neurons or in mice expressing GCaMP6f in DLS-projecting SNc DA neurons. (G) Example of responses to shock observed in a mouse expressing GCaMP6f in DMS-projecting SNc DA neurons. Yellow bar indicates the time of the shock (0–0.5 s). Area of light shading is SEM. (H) Example of responses to shock observed in a mouse expressing GCaMP6f in DLS-projecting SNc DA neurons. (I) Quantification of the peak (extreme, whether negative or positive) ΔF/F observed during the shock in mice expressing GCaMP6f in DMS-projecting SNc DA neurons or in mice expressing GCaMP6f in DLS-projecting SNc DA neurons. ****p < 0.0001. (J) Quantification of the mean ΔF/F observed 1–5 s post-shock in mice expressing GCaMP6f in DMS-projecting SNc DA neurons or in mice expressing GCaMP6f in DLS-projecting SNc DA neurons. ***p < 0.001. The same mice are shown in (C)–(J). See also Figure S4.
Comment in
- Vive la difference! Dissecting the diversity of midbrain dopamine neurons.
Blesa J. Blesa J. Mov Disord. 2016 Jan;31(1):41. doi: 10.1002/mds.26487. Epub 2015 Dec 21. Mov Disord. 2016. PMID: 26686701 No abstract available.
Similar articles
- Cocaine Selectively Reorganizes Excitatory Inputs to Substantia Nigra Pars Compacta Dopamine Neurons.
Beaudoin GMJ 3rd, Gomez JA, Perkins J, Bland JL, Petko AK, Paladini CA. Beaudoin GMJ 3rd, et al. J Neurosci. 2018 Jan 31;38(5):1151-1159. doi: 10.1523/JNEUROSCI.1975-17.2017. Epub 2017 Dec 20. J Neurosci. 2018. PMID: 29263240 Free PMC article. - Selective loss of dopaminergic neurons in the substantia nigra of Pitx3-deficient aphakia mice.
Hwang DY, Ardayfio P, Kang UJ, Semina EV, Kim KS. Hwang DY, et al. Brain Res Mol Brain Res. 2003 Jun 10;114(2):123-31. doi: 10.1016/s0169-328x(03)00162-1. Brain Res Mol Brain Res. 2003. PMID: 12829322 - Impact of serotonin 2C receptor null mutation on physiology and behavior associated with nigrostriatal dopamine pathway function.
Abdallah L, Bonasera SJ, Hopf FW, O'Dell L, Giorgetti M, Jongsma M, Carra S, Pierucci M, Di Giovanni G, Esposito E, Parsons LH, Bonci A, Tecott LH. Abdallah L, et al. J Neurosci. 2009 Jun 24;29(25):8156-65. doi: 10.1523/JNEUROSCI.3905-08.2009. J Neurosci. 2009. PMID: 19553455 Free PMC article. - Environment- and activity-dependent dopamine neurotransmitter plasticity in the adult substantia nigra.
Aumann TD. Aumann TD. J Chem Neuroanat. 2016 Apr;73:21-32. doi: 10.1016/j.jchemneu.2015.12.009. Epub 2015 Dec 21. J Chem Neuroanat. 2016. PMID: 26718607 Review. - Progress in opioid reward research: From a canonical two-neuron hypothesis to two neural circuits.
Galaj E, Xi ZX. Galaj E, et al. Pharmacol Biochem Behav. 2021 Jan;200:173072. doi: 10.1016/j.pbb.2020.173072. Epub 2020 Nov 20. Pharmacol Biochem Behav. 2021. PMID: 33227308 Free PMC article. Review.
Cited by
- Temporal dynamics of cholinergic activity in the septo-hippocampal system.
Kopsick JD, Hartzell K, Lazaro H, Nambiar P, Hasselmo ME, Dannenberg H. Kopsick JD, et al. Front Neural Circuits. 2022 Aug 25;16:957441. doi: 10.3389/fncir.2022.957441. eCollection 2022. Front Neural Circuits. 2022. PMID: 36092276 Free PMC article. - Eavesdropping wires: Recording activity in axons using genetically encoded calcium indicators.
Broussard GJ, Petreanu L. Broussard GJ, et al. J Neurosci Methods. 2021 Aug 1;360:109251. doi: 10.1016/j.jneumeth.2021.109251. Epub 2021 Jun 10. J Neurosci Methods. 2021. PMID: 34119572 Free PMC article. Review. - Cue and Reward Evoked Dopamine Activity Is Necessary for Maintaining Learned Pavlovian Associations.
van Zessen R, Flores-Dourojeanni JP, Eekel T, van den Reijen S, Lodder B, Omrani A, Smidt MP, Ramakers GMJ, van der Plasse G, Stuber GD, Adan RAH. van Zessen R, et al. J Neurosci. 2021 Jun 9;41(23):5004-5014. doi: 10.1523/JNEUROSCI.2744-20.2021. Epub 2021 Apr 22. J Neurosci. 2021. PMID: 33888609 Free PMC article. - Cholinergic Mesopontine Signals Govern Locomotion and Reward through Dissociable Midbrain Pathways.
Xiao C, Cho JR, Zhou C, Treweek JB, Chan K, McKinney SL, Yang B, Gradinaru V. Xiao C, et al. Neuron. 2016 Apr 20;90(2):333-47. doi: 10.1016/j.neuron.2016.03.028. Neuron. 2016. PMID: 27100197 Free PMC article. - Functional and anatomical relationships between the medial precentral cortex, dorsal striatum, and head direction cell circuitry. II. Neuroanatomical studies.
Mehlman ML, Winter SS, Taube JS. Mehlman ML, et al. J Neurophysiol. 2019 Feb 1;121(2):371-395. doi: 10.1152/jn.00144.2018. Epub 2018 Nov 14. J Neurophysiol. 2019. PMID: 30427743 Free PMC article.
References
- Bocklisch C, Pascoli V, Wong JCY, House DRC, Yvon C, de Roo M, Tan KR, Lüscher C. Cocaine disinhibits dopamine neurons by potentiation of GABA transmission in the ventral tegmental area. Science. 2013;341:1521–1525. - PubMed
Publication types
MeSH terms
Substances
Grants and funding
- F32 DA038913/DA/NIDA NIH HHS/United States
- 1F31MH105151-01/MH/NIMH NIH HHS/United States
- R37 DA035377/DA/NIDA NIH HHS/United States
- 1F32MH105053-01/MH/NIMH NIH HHS/United States
- F31 MH105151/MH/NIMH NIH HHS/United States
- P50 MH086403/MH/NIMH NIH HHS/United States
- HHMI/Howard Hughes Medical Institute/United States
- F32 MH105053/MH/NIMH NIH HHS/United States
LinkOut - more resources
Full Text Sources
Other Literature Sources
Molecular Biology Databases
Miscellaneous


