Selective enhancement of insulin sensitivity in the mature adipocyte is sufficient for systemic metabolic improvements - PubMed (original) (raw)
Selective enhancement of insulin sensitivity in the mature adipocyte is sufficient for systemic metabolic improvements
Thomas S Morley et al. Nat Commun. 2015.
Abstract
Dysfunctional adipose tissue represents a hallmark of type 2 diabetes and systemic insulin resistance, characterized by fibrotic deposition of collagens and increased immune cell infiltration within the depots. Here we generate an inducible model of loss of function of the protein phosphatase and tensin homologue (PTEN), a phosphatase critically involved in turning off the insulin signal transduction cascade, to assess the role of enhanced insulin signalling specifically in mature adipocytes. These mice gain more weight on chow diet and short-term as well as long-term high-fat diet exposure. Despite the increase in weight, they retain enhanced insulin sensitivity, show improvements in oral glucose tolerance tests, display reduced adipose tissue inflammation and maintain elevated adiponectin levels. These improvements also lead to reduced hepatic steatosis and enhanced hepatic insulin sensitivity. Prolonging insulin action selectively in the mature adipocyte is therefore sufficient to maintain normal systemic metabolic homeostasis.
Figures
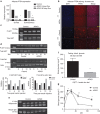
Figure 1. Inducible PTEN elimination from the adipocyte.
(a) Quantitative PCR results on a floated adipocyte fraction showing PTEN gene expression from mice fed a doxycycline (600 mg kg−1) diet for 4 or 30 days (mean of _N_=2 for each bar). (b) Gonadal adipose tissue immunofluorescence using a PTEN antibody (Abcam 32199) with 4,6-diamidino-2-phenylindole (DAPI) counterstain to show nuclei. (Scale bar, 152 μm for × 4, 65 μm for × 15.) (c) Phospho-AKT, total AKT and actin for isolated adipocytes stimulated with insulin (1 nM) for 10 min (d) Western blot of protein extracts from gonadal adipose tissue harvested from mice stimulated with insulin for the indicated amount of time. Staining was then performed against phospho-AKT (S473), total AKT, p44/42 or total actin as indicated and then quantified using a Licor Imager (1 mouse for each group (control or AiPKO) at each time point, 0, 5, 10 or 15 min). (e) Western blot for plasma adiponectin levels from mice after 4 weeks of a doxycycline-containing chow diet (_N_=3 for each group). (f) Blood glucose of mice fasted for 4 h (_N_=4 for each group). (g) Oral glucose tolerance test of mice on a doxycycline-containing chow diet for 4 weeks (average area under the curve—control=28,588, AiPKO=17,001, P value=0.0221; Student's _T_-test) (_N_=3 for each group). All data compare control mice with AiPKO mice. For all points, *P<0.05, **P<0.01 (Student's _T_-test). All data are mean±s.e.m.
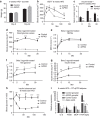
Figure 2. Effects of inducible loss of PTEN in adipocytes during high-fat diet exposure.
(a) Body weights of mice fed a doxycycline (600 mg kg−1) high-fat diet starting at 6 weeks of age for the subsequent 42 days (_N_=5 for each group). (b) Concentration of glucose in blood of mice gavaged with 2.5 g kg−1 glucose body weight (_n_=5 for each group, average area under the curve—control=37,827, AiPKO=22877, _P_=0.0011). (c) Serum insulin concentrations of mice during oral glucose tolerance test shown in (b). (d) Blood glucose levels in mice following injection of the β3-adrenergic agonist CL316,243 at 0.5 mg kg−1 (_n_=4 control and 5 AiPKO). (e) NEFA (f) free glycerol and (g) insulin levels in the mice from d. (h) Blood glucose levels displayed as a percent of fasting following injection with insulin (0.5 IU kg−I). (i) Inflammatory gene expression in adipose tissue from mice fed a HFD doxycycline-containing diet for 6 weeks (_N_=3 for each group). All data compare control mice with AiPKO mice. For all points, *P<0.05, **P<0.01, ***P<0.001 (Student's _T_-test). All data are mean±s.e.m.
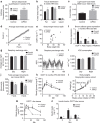
Figure 3. Metabolic characterization after inducible loss of PTEN in adipocytes.
(a) Serum adiponectin levels of mice fed HFD doxycycline diet for 6 weeks, quantified using a Licor western blot scanner (_N_=6 control and 4 AiPKO). Full blot in Supplementary Fig. 1. (b) Tissue distribution determined by a Bruker MQ10 NMR analyzer and expressed as percent of total body weight (_N_=5 in both groups). (c) Average food intake per mouse per hour during peak light cycle (sleep cycle, 0900–1500 hours) in a metabolic cage analysis (_N_=4 control and 6 AiPKO). (d) Average total food intake per mouse over the 4 days of metabolic cage analysis (_N_=4 control and 6 AiPKOs). (e) Circulating leptin levels versus body weight after 6 weeks of HFD containing doxycycline (600 mg kg−1) in the AiPKO and control mice as measured by ELISA (Millipore EZML-82K) (_N_=8 for each group). (f) Gene expression in brown adipose tissue following 6 weeks of doxycycline (600 mg kg−1) containing diet (_N_=3 control and 2 AiPKO). (g) Respiratory exchange ratios (RERs) for day and night cycles averaged per 12-h period per mouse (_N_=4 control and 6 AiPKOs). (h) Average respiratory exchange ratios for each group taken every 1.5 h over the 4 days of metabolic cage analysis (_N_=4 control and 6 AiPKOs). (i) Volume of consumed oxygen for day and night periods, averaged per mouse, per hour, per kilogram (_N_=4 control and 6 AiPKOs). (j) Average total movements per mouse during metabolic cage analysis (96 h) (_N_=4 control and 6 AiPKOs). (k) Concentration of glucose in blood during OGTT (2.5 g kg−1) after 8 weeks of HFD feeding without doxycycline (average AUC; control: 27,725, AiPKO: 32,702, Student's test on AUC _P_-value=0.4246). (l) Average body weights of mice in a cohort fed 8 weeks on HFD, followed by 8 more weeks of HFD containing doxycycline (600 mg kg−1) (_N_=7 control and 3 AiPKO). (m) Concentration of glucose in blood of mice from (l) during OGTT (2.5 g kg−1) after 8 weeks of HFD feeding without doxycycline followed by 4 weeks of HFD feeding containing doxycycline (600 mg kg−1) (average AUC; control: 32,087, AiPKO: 18,951; _P_-value=0.0279). (n) Serum insulin concentrations of mice during an oral glucose tolerance test, as shown in (m). *P<0.05, **P<0.01. All data are shown as mean±s.e.m.
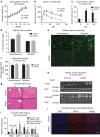
Figure 4. AiPKO mice display improvements even after a long-term HFD insult.
(a) Body weights of HFD doxycycline- (600 mg kg−1) fed mice for 23 weeks (_N_=4 for each group). (b) Concentration of glucose in blood of mice gavaged with 2.5 g kg−1 body weight (_n_=4 for each group) (average area under the curve—control=41,601, AiPKO=22,960, _P_=0.0007). (c) Insulin levels of mice during the oral glucose tolerance test shown in b. (d) Adipose depot weights at the time of killing for each cohort (_n_=4 for both groups). (e) Autofluorescent image (excitation at 480 nm) of adipocytes from AiPKO and control mice (scale bar, 81 μm). (f) Quantification of the number of adipocytes observed per field at × 4 magnification using ImageJ software from the subcutaneous and gonadal adipose depots of both control and AiPKO mice (_N_=2 mice for each group (control and AiPKO) and three fields of view for each tissue section, total six fields per group). (g) Liver histology (haematoxylin and eosin stain) of control and AiPKO mice after 5 months of HFD doxycycline feeding. Scale bar for the × 4 magnification: 132 μm; for × 20 magnification: 32 μm. (h) Western blot of liver protein extracts from mice treated with PBS or insulin for 15 min prior to killing (_N_=4 for each group, 2 receiving insulin and 2 controls). (i) Quantitative PCR analysis of adipose depots inflammatory gene expression from controls and AiPKO mice following 5 months of HFD feeding (significance values, subcutaneous adipose—F4/80 _P_=0.7401, MCP-1 _P_=0.4230, Il-6 _P_=0.4475, TNF-α _P_=0.8050, gonadal adipose—F4/80 _P_=0.0538, MCP-1 _P_=0.1506, Il-6 _P_=0.0093, TNF- α _P_=0.2948) (_N_=3 for each group). (j) Gonadal adipose depot staining for macrophage infiltration after 5 months of HFD feeding using an anti-Mac2 antibody with a 4,6-diamidino-2-phenylindole (DAPI) counterstain. Scale bar, 132 μm for × 4 magnification. (The experiment was performed on _N_=3 mice for each group.) All data compare control mice with AiPKO mice. For all points, *P<0.05, **P<0.01, ***P value<0.001 (Student's _T_-test). All data are mean±s.e.m.
Similar articles
- Adipocyte-specific Hypoxia-inducible gene 2 promotes fat deposition and diet-induced insulin resistance.
DiStefano MT, Roth Flach RJ, Senol-Cosar O, Danai LV, Virbasius JV, Nicoloro SM, Straubhaar J, Dagdeviren S, Wabitsch M, Gupta OT, Kim JK, Czech MP. DiStefano MT, et al. Mol Metab. 2016 Sep 28;5(12):1149-1161. doi: 10.1016/j.molmet.2016.09.009. eCollection 2016 Dec. Mol Metab. 2016. PMID: 27900258 Free PMC article. - Adipocyte insulin receptor activity maintains adipose tissue mass and lifespan.
Friesen M, Hudak CS, Warren CR, Xia F, Cowan CA. Friesen M, et al. Biochem Biophys Res Commun. 2016 Aug 5;476(4):487-492. doi: 10.1016/j.bbrc.2016.05.151. Epub 2016 May 28. Biochem Biophys Res Commun. 2016. PMID: 27246738 - Macrophage migration inhibitory factor deficiency ameliorates high-fat diet induced insulin resistance in mice with reduced adipose inflammation and hepatic steatosis.
Finucane OM, Reynolds CM, McGillicuddy FC, Harford KA, Morrison M, Baugh J, Roche HM. Finucane OM, et al. PLoS One. 2014 Nov 20;9(11):e113369. doi: 10.1371/journal.pone.0113369. eCollection 2014. PLoS One. 2014. PMID: 25412423 Free PMC article. - Metabolic Role of PTEN in Insulin Signaling and Resistance.
Li YZ, Di Cristofano A, Woo M. Li YZ, et al. Cold Spring Harb Perspect Med. 2020 Aug 3;10(8):a036137. doi: 10.1101/cshperspect.a036137. Cold Spring Harb Perspect Med. 2020. PMID: 31964643 Free PMC article. Review. - Insulin action in adipocytes, adipose remodeling, and systemic effects.
Santoro A, McGraw TE, Kahn BB. Santoro A, et al. Cell Metab. 2021 Apr 6;33(4):748-757. doi: 10.1016/j.cmet.2021.03.019. Cell Metab. 2021. PMID: 33826917 Free PMC article. Review.
Cited by
- Association between visceral adipose tissue and total testosterone among the United States male adults: a cross-sectional study.
Gu X, Zhu F, Gao P, Shen Y, Lu L. Gu X, et al. Int J Impot Res. 2024 Apr 23. doi: 10.1038/s41443-024-00856-z. Online ahead of print. Int J Impot Res. 2024. PMID: 38653801 - Inhibition of AXL receptor tyrosine kinase enhances brown adipose tissue functionality in mice.
Efthymiou V, Ding L, Balaz M, Sun W, Balazova L, Straub LG, Dong H, Simon E, Ghosh A, Perdikari A, Keller S, Ghoshdastider U, Horvath C, Moser C, Hamilton B, Neubauer H, Wolfrum C. Efthymiou V, et al. Nat Commun. 2023 Jul 13;14(1):4162. doi: 10.1038/s41467-023-39715-8. Nat Commun. 2023. PMID: 37443109 Free PMC article. - The World Congress of Insulin Resistance, Diabetes and Cardiovascular Disease (WCIRDC).
Bloomgarden ZT. Bloomgarden ZT. J Diabetes. 2023 Jan;15(1):4-6. doi: 10.1111/1753-0407.13349. Epub 2023 Jan 6. J Diabetes. 2023. PMID: 36610044 Free PMC article. No abstract available. - Is subcutaneous adipose tissue expansion in people living with lipedema healthier and reflected by circulating parameters?
Nankam PAN, Cornely M, Klöting N, Blüher M. Nankam PAN, et al. Front Endocrinol (Lausanne). 2022 Oct 31;13:1000094. doi: 10.3389/fendo.2022.1000094. eCollection 2022. Front Endocrinol (Lausanne). 2022. PMID: 36387874 Free PMC article. - Role of insulin action in the pathogenesis of diabetic complications.
Tsuchiya K. Tsuchiya K. Diabetol Int. 2022 Sep 7;13(4):591-598. doi: 10.1007/s13340-022-00601-1. eCollection 2022 Oct. Diabetol Int. 2022. PMID: 36117926 Free PMC article. Review.
References
- Nawrocki A. R. & Scherer P. E. The delicate balance between fat and muscle: adipokines in metabolic disease and musculoskeletal inflammation. Curr. Opin. Pharmacol. 4, 281–289 (2004). - PubMed
- Bluher M. et al. Adipose tissue selective insulin receptor knockout protects against obesity and obesity-related glucose intolerance. Dev. Cell 3, 25–38 (2002). - PubMed
- Abel E. D. et al. Adipose-selective targeting of the GLUT4 gene impairs insulin action in muscle and liver. Nature 409, 729–733 (2001). - PubMed
- Scherer P. E., Williams S., Fogliano M., Baldini G. & Lodish H. F. A novel serum protein similar to C1q, produced exclusively in adipocytes. J. Biol. Chem. 270, 26746–26749 (1995). - PubMed
Publication types
MeSH terms
Substances
Grants and funding
- T32-GM083831/GM/NIGMS NIH HHS/United States
- P01 DK088761/DK/NIDDK NIH HHS/United States
- R01-DK55758/DK/NIDDK NIH HHS/United States
- P01-DK088761/DK/NIDDK NIH HHS/United States
- F30-DK100095/DK/NIDDK NIH HHS/United States
- T32 GM083831/GM/NIGMS NIH HHS/United States
- R01-DK099110/DK/NIDDK NIH HHS/United States
- R01 DK099110/DK/NIDDK NIH HHS/United States
- F30 DK100095/DK/NIDDK NIH HHS/United States
- R01 DK055758/DK/NIDDK NIH HHS/United States
LinkOut - more resources
Full Text Sources
Other Literature Sources
Medical
Molecular Biology Databases
Research Materials


