Ezrin regulates focal adhesion and invadopodia dynamics by altering calpain activity to promote breast cancer cell invasion - PubMed (original) (raw)
Ezrin regulates focal adhesion and invadopodia dynamics by altering calpain activity to promote breast cancer cell invasion
Victoria Hoskin et al. Mol Biol Cell. 2015.
Abstract
Up-regulation of the cytoskeleton linker protein ezrin frequently occurs in aggressive cancer types and is closely linked with metastatic progression. However, the underlying molecular mechanisms detailing how ezrin is involved in the invasive and metastatic phenotype remain unclear. Here we report a novel function of ezrin in regulating focal adhesion (FA) and invadopodia dynamics, two key processes required for efficient invasion to occur. We show that depletion of ezrin expression in invasive breast cancer cells impairs both FA and invadopodia turnover. We also demonstrate that ezrin-depleted cells display reduced calpain-mediated cleavage of the FA and invadopodia-associated proteins talin, focal adhesion kinase (FAK), and cortactin and reduced calpain-1-specific membrane localization, suggesting a requirement for ezrin in maintaining proper localization and activity of calpain-1. Furthermore, we show that ezrin is required for cell directionality, early lung seeding, and distant organ colonization but not primary tumor growth. Collectively our results unveil a novel mechanism by which ezrin regulates breast cancer cell invasion and metastasis.
© 2015 Hoskin et al. This article is distributed by The American Society for Cell Biology under license from the author(s). Two months after publication it is available to the public under an Attribution–Noncommercial–Share Alike 3.0 Unported Creative Commons License (http://creativecommons.org/licenses/by-nc-sa/3.0).
Figures
FIGURE 1:
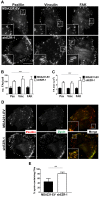
Ezrin regulates FA stability. (A) MDA231-EV and ezrin-depleted cells stained by immunofluorescence with anti-paxillin, anti-vinculin, or anti-FAK antibodies and imaged using TIRF microscopy. Boxed areas depict regions of FAs that are magnified in insets (100×). (B, C) Quantification of the number and size of FAs. (D) Cells stained by immunofluorescence using anti-paxillin and anti-zyxin antibodies and imaged using TIRF microscopy. (E) The percentage of zyxin-containing FAs was quantified by dividing the number of FAs in which zyxin and paxillin colocalized by the total number of paxillin-containing FAs counted. Data shown represent means + SD of at least three independent experiments. A minimum of 30 cells per FA protein were analyzed. **p < 0.01 by unpaired t test (E); ***p < 0.0001 by two-way ANOVA comparing all shEZR-1 to MDA231-EV values (B, C). Scale bars, 15 μm.
FIGURE 2:
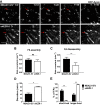
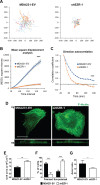
Ezrin is required for proper FA turnover. (A) RFP-zyxin was transiently transfected into MDA231-EV and ezrin-depleted (shEZR-1) cells and analyzed by time-lapse fluorescence microscopy for a minimum of 3 h. Images are representative of the dynamics of the FA marker RFP-zyxin over a period of 40 min. Red arrows indicate FAs. Scale bar, 5 μm. Rate constants for assembly (B) and disassembly (C) were calculated as described in Materials and Methods. (D) The mean duration of FAs for each cell type was calculated. (E) The percentage of short- and longer-lived FAs was quantified, with short-lived adhesions defined as those that formed and disassembled within 40 min; any FAs with a duration >40 min were counted as longer lived. Data shown represent means + SD of three independent experiments, with a minimum of 40 FAs analyzed per experiment. *p < 0.02 and ** p < 0.007 by unpaired t test (C, D) or two-way ANOVA (E); ns, not significant.
FIGURE 3:
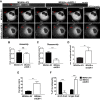
Ezrin regulates Src-induced invadopodia dynamics. (A) GFP-cortactin was transiently transfected into MDASrc-EV and MDASrc ezrin-depleted (MDASrc shEZR-1) cells and analyzed by time-lapse fluorescence microscopy for a minimum of 3 h. Images are representative of the dynamics of GFP-cortactin over a period of 10 min. The xy images (top) demonstrate that the invadopodia that formed protrude downward into the matrix. Rate constants for the assembly (B) and disassembly (C) of invadopodia were calculated as described in Materials and Methods. Mean duration of invadopodia (D) and number of invadopodia per cell (E). (F) Percentage of short- and longer-lived invadopodia; invadopodia that formed and disassembled within 10 min were counted as short lived, and those that persisted for >10 min were considered longer lived. Data shown represent means + SD of three independent experiments. A minimum of 40 invadopodia was analyzed per experiment. **p < 0.01 and ***p < 0.001 by unpaired t test (C–E) or two-way ANOVA (F); ns, not significant. Scale bar, 15 μm.
FIGURE 4:
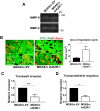
Ezrin does not regulate MMP secretion but is required for invasion and transendothelial migration. (A) Conditioned media from MDASrc-EV and ezrin-depleted MDASrc cells were collected and analyzed by gelatin zymography for MMP-2 and MMP-9 activity. (B) Cells were plated onto FITC-fibronectin gelatin coverslips for 72 h, fixed, and stained with F-actin (red). For each cell type, the total area of matrix digestion (dark spots) was calculated using ImagePro Plus 6.0 software. (C) Cells (5 × 10⁴) were seeded onto Transwell inserts coated with 100 μl of 20% Matrigel and allowed to invade for 18 h. Invaded cells were stained with DAPI and quantified using Image ProPlus 6.0 software. (D) Cells (2 × 10⁴) labeled with a green cell tracker were seeded onto an endothelial monolayer in a Transwell insert and allowed to migrate for 6 h. Invaded and migrated cells were quantified using Image ProPlus. Data shown represent means + SD of three independent experiments. *p < 0.05 and ***p < 0.0001 by unpaired t test (B) or one-sample t test (C, D). Scale bar, 30 μm.
FIGURE 5:
Ezrin is required for directional cell migration and front–rear polarization. (A) MDA231-EV and ezrin-depleted (shEZR-1) cells were plated sparsely onto collagen I–coated eight-well Ibidi dishes and analyzed by time-lapse microscopy for 18 h. Cell trajectory data were generated using MetaMorph software and plotted using GraphPad Prism software. MSD (B) and direction autocorrelation (C) analyses were carried out using the open source program DiPer. (D) Representative images of MDA231-EV and shEZR-1 cells stained for F-actin using Alexa 488–phalloidin. The xz- planes (bottom) show the relative flatness of the cells. A minimum of 30 cells per line were analyzed. (E) Cell areas were calculated by tracing individual cell outlines using MetaMorph software. (F) The percentage of polarized and nonpolarized cells. Polarized cells were defined as cells that displayed stress fibers aligned along the front–rear axis. (G) The axial ratio, defined as the ratio of the long axis to the short axis of the cell, calculated using F-actin–stained confocal images of cells. Data represent means ± SE (B, C) or + SD (E–G) of three independent experiments. *p < 0.05 and **p < 0.01 by unpaired t test (E, G); ***p < 0.001 by linear regression analysis (B), or unpaired t test from 10 to 180 min (C), or two-way ANOVA (F). Scale bar, 15 μm.
FIGURE 6:
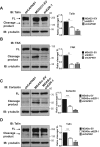
Ezrin is required for calpain-mediated cleavage of talin, FAK, and cortactin. Lysates from MDA231-EV and shEZR-1 (A, B) or MDASrc-EV and MDASrc shEZR-1 (C, D) cells were analyzed by immunoblotting using anti-talin, anti-FAK, anti-cortactin, or anti-γ-tubulin antibodies. MDA231 CAPNS1-depleted (shCAPNS1) cell lysates were used to verify the calpain-specific cleavage product for talin, FAK, and cortactin. Quantification of immunoblots was done using densitometry and the results expressed as the fold change in cleavage product to full-length (FL) protein or relative to the control MDA231-EV or MDASrc-EV as described in Materials and Methods. Black lines represent merged lanes (vertical) or sections (horizontal) from different areas of the same gel, except for the shCAPNS1 talin lane, which was from a separate gel. Data shown represent means + SD of at least three independent experiments. **p < 0.01 and ***p < 0.001 by one-way ANOVA.
FIGURE 7:
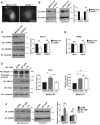
Ezrin is required for membrane localization and expression of calpain-1. (A) MDA231-EV and ezrin-depleted cells were stained by immunofluorescence using anti-CAPN1 antibody and images acquired by spinning disk confocal microscopy. Arrow points to membrane localization of CAPN1. Representative images taken at the same z_-axis plane, near the ventral surface of the cell, for each cell line. A minimum of 30 cells per group were analyzed. (B) Membrane (concentrated sevenfold) and cytoplasmic fractions were immunoblotted with anti-CAPN1 and anti–calpain-2 antibodies. (C) MDA231-EV and shEZR-1 cell lysates were assessed by immunoblotting using anti-CAPN1, anti-calpain-2, and anti- γ-tubulin antibodies. Densitometric analysis was performed to quantify changes in CAPN1 and CAPN2 protein expression relative to MDA231-EV cells. (D) Quantitative real-time PCR was performed to analyze capn1 and capn2 mRNA levels from MDA231-EV and ezrin-depleted cells. (E) MDA231-EV cells were transiently transfected with empty vector control (pCB6), wild-type ezrin (WT EZR), or a mutant form of ezrin with alanine substituted for threonine at residue 567 (T/A). Both WT EZR and T/A were tagged at the N-terminus with VSV-G. Cell lysates were analyzed by Western blotting using anti-ezrin, anti-talin, anti–VSV-G, or anti–γ-tubulin antibodies. Densitometry was performed to assess the fold change in talin cleavage relative to full-length protein, as well as the amount of exogenous ezrin present in WT and T/A transfected cells relative to pCB6. (F) Membrane (concentrated sevenfold) and cytoplasmic fractions from pCB6, WT EZR, and T/A-overexpressing MDA231-EV cells were immunoblotted for anti-CAPN1 and anti-calpain-2 antibodies. (B, F) Membrane-to-cytoplasmic (memb/cyto) ratios of CAPN1 and CAPN2 were assessed by densitometric analysis of immunoblots from the same exposure and normalized to control MDA231-EV or pCB6. For each protein, membrane and cytoplasmic lysates were run on the same gel. Data shown represent means + SD of three independent experiments. **p < 0.01 and ***p < 0.001 by one-sample t test (B), or one-way ANOVA with Tukey’s multiple comparison test (E, F). ††_p < 0.002 by one-sample t test (C). Scale bars, 15 μm; ns, not significant.
FIGURE 8:
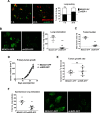
Ezrin is required for early lung seeding events and colonization but not primary tumor growth. (A) MDA231-EV (red) and ezrin-depleted (shEZR-1) cells (green) were mixed in equal proportions and injected into the tail veins of mice. Representative confocal images of lungs harvested 1 or 24 h postinjection. Histogram denotes the relative proportion of cells at the indicated times (five mice per group per time point). (B) Representative biophotonic images of lungs harvested 3 wk after tail vein injection of GFP-labeled MDA231 and ezrin-depleted cells (five mice per group). The total number of lung colonies was quantified using ImagePro Plus 6.0 software. (C) Tumor burden evaluated as the percentage of GFP-positive pixel areas relative to total lung area. (D) Primary tumor volumes measured and calculated as described in Materials and Methods (six mice per group). (E) Tumor growth rates generated from the slopes of tumor growth curves. (F) Representative biophotonics images of lungs harvested 24 d after tumor injection (six mice per group). Data shown represent means ± SD. **p < 0.01 by Mann–Whitney U test (F) and ***p < 0.001 by unpaired t test (A) or Mann–Whitney U test (B, C).
FIGURE 9:
Model for ezrin regulation of calpain-1 and FA/invadopodia dynamics. Plasma membrane localization of ezrin and calpain-1 is important for their function. By facilitating anchorage of calpain-1 to the cell periphery, ezrin promotes FA and invadopodia turnover by placing calpain-1 in close proximity to its substrates—talin, FAK, and cortactin. Depleting ezrin expression (by shRNA) or inhibiting its open active conformation (by T/A mutation) perturbs calpain-1–membrane linkage and therefore cleavage of the calpain substrates necessary for efficient FA/invadopodia disassembly, resulting in impaired cancer cell invasion.
Similar articles
- Revealing the three dimensional architecture of focal adhesion components to explain Ca2+-mediated turnover of focal adhesions.
Chang SJ, Chen YC, Yang CH, Huang SC, Huang HK, Li CC, Harn HI, Chiu WT. Chang SJ, et al. Biochim Biophys Acta Gen Subj. 2017 Mar;1861(3):624-635. doi: 10.1016/j.bbagen.2017.01.002. Epub 2017 Jan 5. Biochim Biophys Acta Gen Subj. 2017. PMID: 28063985 - FAK alters invadopodia and focal adhesion composition and dynamics to regulate breast cancer invasion.
Chan KT, Cortesio CL, Huttenlocher A. Chan KT, et al. J Cell Biol. 2009 Apr 20;185(2):357-70. doi: 10.1083/jcb.200809110. Epub 2009 Apr 13. J Cell Biol. 2009. PMID: 19364917 Free PMC article. - Calpain 2 and PTP1B function in a novel pathway with Src to regulate invadopodia dynamics and breast cancer cell invasion.
Cortesio CL, Chan KT, Perrin BJ, Burton NO, Zhang S, Zhang ZY, Huttenlocher A. Cortesio CL, et al. J Cell Biol. 2008 Mar 10;180(5):957-71. doi: 10.1083/jcb.200708048. J Cell Biol. 2008. PMID: 18332219 Free PMC article. - [Advances of the Role of Ezrin in Migration and Invasion of Breast Cancer Cells].
Long ZY, Wang TH. Long ZY, et al. Sheng Li Ke Xue Jin Zhan. 2016 Feb;47(1):21-6. Sheng Li Ke Xue Jin Zhan. 2016. PMID: 27424401 Review. Chinese. - Targeting invadopodia for blocking breast cancer metastasis.
Meirson T, Gil-Henn H. Meirson T, et al. Drug Resist Updat. 2018 Jul;39:1-17. doi: 10.1016/j.drup.2018.05.002. Epub 2018 May 17. Drug Resist Updat. 2018. PMID: 30075834 Review.
Cited by
- Ezrin expression in circulating tumor cells is a predictor of prostate cancer metastasis.
Chen Z, Wang J, Lu Y, Lai C, Qu L, Zhuo Y. Chen Z, et al. Bioengineered. 2022 Feb;13(2):4076-4084. doi: 10.1080/21655979.2021.2014710. Bioengineered. 2022. PMID: 35156523 Free PMC article. - Ezrin drives adaptation of monocytes to the inflamed lung microenvironment.
Gudneppanavar R, Di Pietro C, H Öz H, Zhang PX, Cheng EC, Huang PH, Tebaldi T, Biancon G, Halene S, Hoppe AD, Kim C, Gonzalez AL, Krause DS, Egan ME, Gupta N, Murray TS, Bruscia EM. Gudneppanavar R, et al. Cell Death Dis. 2024 Nov 29;15(11):864. doi: 10.1038/s41419-024-07255-8. Cell Death Dis. 2024. PMID: 39613751 Free PMC article. - Targeting the Ezrin Adaptor Protein Sensitizes Metastatic Breast Cancer Cells to Chemotherapy and Reduces Neoadjuvant Therapy-induced Metastasis.
Hoskin V, Ghaffari A, Laight BJ, SenGupta S, Madarnas Y, Nicol CJB, Elliott BE, Varma S, Greer PA. Hoskin V, et al. Cancer Res Commun. 2022 Jun 17;2(6):456-470. doi: 10.1158/2767-9764.CRC-21-0117. eCollection 2022 Jun. Cancer Res Commun. 2022. PMID: 36923551 Free PMC article. - Inhibition of calpain 1 restores plasma membrane stability to pharmacologically rescued Phe508del-CFTR variant.
Matos AM, Pinto FR, Barros P, Amaral MD, Pepperkok R, Matos P. Matos AM, et al. J Biol Chem. 2019 Sep 6;294(36):13396-13410. doi: 10.1074/jbc.RA119.008738. Epub 2019 Jul 19. J Biol Chem. 2019. PMID: 31324722 Free PMC article. - Differential microRNA expression profiles determined by next-generation sequencing in three fulvestrant-resistant human breast cancer cell lines.
Guo J, He K, Zeng H, Shi Y, Ye P, Zhou Q, Pan Z, Long X. Guo J, et al. Oncol Lett. 2019 Apr;17(4):3765-3776. doi: 10.3892/ol.2019.10061. Epub 2019 Feb 21. Oncol Lett. 2019. PMID: 30930984 Free PMC article.
References
- Bretscher A, Edwards K, Fehon RG. ERM proteins and merlin: integrators at the cell cortex. Nat Rev Mol Cell Biol. 2002;3:586–599. - PubMed
Publication types
MeSH terms
Substances
LinkOut - more resources
Full Text Sources
Medical
Research Materials
Miscellaneous
