Individuality and variation of personal regulomes in primary human T cells - PubMed (original) (raw)
Individuality and variation of personal regulomes in primary human T cells
Kun Qu et al. Cell Syst. 2015.
Abstract
Here we survey variation and dynamics of active regulatory elements genome-wide using longitudinal samples from human individuals. We applied Assay of Transposase Accessible Chromatin with sequencing (ATAC-seq) to map chromatin accessibility in primary CD4+ T cells isolated from standard blood draws of 12 healthy volunteers over time, from cancer patients, and during T cell activation. Over 4,000 predicted regulatory elements (7.2%) showed reproducible variation in accessibility between individuals. Gender was the most significant attributable source of variation. ATAC-seq revealed previously undescribed elements that escape X chromosome inactivation and predicted gender-specific gene regulatory networks across autosomes, which coordinately affect genes with immune function. Noisy regulatory elements with personal variation in accessibility are significantly enriched for autoimmune disease loci. Over one third of regulome variation lacked genetic variation in cis, suggesting contributions from environmental or epigenetic factors. These results refine concepts of human individuality and provide a foundational reference for comparing disease-associated regulomes.
Figures
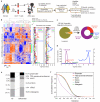
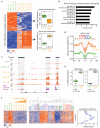
Figure 1. Landscape of individual variation in T cell regulome
a, Schematic outline of study design. b, Heatmap of regulatory elements with differential activity. Each column is a sample; each row is an element. Samples and elements are organized by two dimensional hierarchical clustering. Color scale indicates relative ATAC-seq signal as indicated. Top: Samples from the same donor are labeled with the same color, and sample id is coded with gender, donor ID, sample day, and replicate number. E.g. F9D38R1 indicates this sample is female, from donor 9 drawn at day 38 and is the first replicate. Middle: three clusters of differential accessible elements of interest. Right: correlation of cluster activity with demographic variables and T cell subtype signatures is shown in corresponding color. The dotted line indicates _p_=0.01, FDR <0.05. Cluster i and iii are associated with gender; cluster ii is associated with a Th2 signature. c, Distribution of the variable regulatory element associated with attributable demographic features. d, Significance of the association of the variable regulatory element activity with demographic features. e, Distribution of genomic features of all and differential accessible elements, respectively. f, Scale of variance of genomic features of all elements with accessibility.
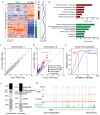
Figure 2. Regulatory variation in sex chromosomes
a, Association of gender-specific regulatory activity with sex chromosomes. Left: heat map, color scale indicates relative ATAC-seq signal as indicated; Middle: bar graph indicates regulatory elements on chromosome X (dark red) and Y (dark green); Right: For each regulatory element, an FDR of significance estimated from random permutation. b, Gene Ontology terms enriched in female (dark red) and male (dark green)-enriched regulatory elements. c,d, Male vs. female ATAC-seq signal across an autosome (chr1) or X chromosome. Dotted lines indicate slopes of 1 and 2 respectively. Regulatory elements of X inactivated and of known, predicted, and novel to escape XCI were color coded as described in the figure. Scales represent average coverage per base. The X-axis and Y-axis indicate the average base coverage. e, Statistical power of ATAC-seq (red) vs. microarray (blue) to detect known XCI escapee genes is shown. ATAC-seq requires 11 samples of each gender while microarray requires 81 samples of each gender to reach a power of 0.95 (dotted line, _p_=0.01). f, Distribution of genomic features in elements that are X inactivated (left) or escape XCI (right). g, Normalized male vs. female specific ATAC-seq signal at gene FIRRE locus. The enhancer associated histone modification H3K27ac in mixed gender samples is shown for comparison.
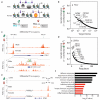
Figure 3. Gender-specific T cell regulome across autosomes
a, Schematic of strategy to construct gender-specific gene regulatory network. Three TFs, A-C, are depicted; B and C bind a target gene differentially depending on gender. Purple arrows depict expected ATAC-seq signal. b. Rank ordered genes with predicted gender-specific regulatory variation across their cognate loci. c, Genomic tracks of FGL2 locus showing ATAC-seq signal in male vs. female samples. Top: Differential TF occupancy, defined as the TF occupancy score in male samples minus female samples, is shown. Upward signal indicates greater occupancy in males; downward signal indicates greater occupancy in females. The identity of the TF with gender-specific signal is shown. Bottom: Zoom in view to visualize the ATAC-seq footprint at an IRF motif. d, Rank ordered TFs with with gender-specific variation in occupancy profiles. e, Genomic track of NeST-IFNG locus; gender-specific signal displayed as in panel c. f, Functional enrichment of top 1000 genes with gender-specific differences in ATAC-seq signal. Black: Gene Ontology terms. Red: Disease terms.
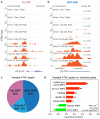
Figure 4. Intersection of regulome variation with genetic variation
a, Example of a reproducible regulome variation without underlying sequence variation. b, Example of a reproducible regulome variation with underlying sequence variation; genotype of the two SNPs in each individual is indicated. c, Regulome variation intersection with detected SNPs (dark blue) and imputed SNPs (light blue). Over a third of variable peaks do not intersect with SNPs (light purple). d, Enrichment of the indicated classes of SNPs in variable ATAC-seq peaks vs. invariant peaks. Autoimmune causal SNPs showed highest enrichment.
Figure 5. Regulome dynamics during T cell activation
a, Left: heat map showing time course of regulatory elements with differential ATAC-seq activity during T cell activation. Each column is a sample; each row is an element. Samples and elements are organized by supervised hierarchical clustering. Color scale indicates relative ATAC-seq signal as indicated. Samples from untreated control and 4 hours control are colored green, and T cell activation at 1, 2, and 4 hours are colored orange. Right: box-plots of mRNA expression levels of the indicated genes in untreated control CD4+ T cells or after 4 hours activation with anti-CD3/CD28. Number of replicates = 15. _P_-value estimated from Student t-test. b, Gene Ontology terms of regulatory elements gain in accessibility during T cell activation. c, Dynamics of ATAC-seq signal at IL2 locus (orange track) during T cell activation (TCA) at the indicated times. NFAT ChIP-seq data in Jurkat cells (purple track) is shown for comparison. d, Visualization of ATAC-seq footprint for transcription factor NFAT (motif shown) in control cells (green) vs. cells after T cell activation for 4 hours (orange). ATAC-seq signal across all NFAT binding sites in the genome were aligned on the motif and averaged. e, Box-plots of mRNA expression levels of IL2 in untreated control (green) and 4 hours T cell activation with anti-CD3/CD28 (orange), obtained from Nanostring (left) and microarray (right). mRNA level from 355 or 15 healthy donors were measured by Nanostring or microarray, respectively. Log2 data are shown; _P_-value estimated from Student t-test. f, Use of regulome signature of T cell activation to interpret individual variation. Regulatory element accessibility during T cell activation in vitro (left) vs. personal variation from healthy donors (right) are shown. Cluster ii from Figure 1b is found to exhibit coordinate deactivation during T cell activation and is also correlated with a Th2 signature. Donor sample dendrogram and demographic correlation are as in Figure 1b.
Figure 6. Scale of regulatory variation in as function of individuality versus disease
Regulome variation in CD4+ T cells derived from normal donors (green), during T cell activation (blue), or in T cell leukemia (red) are ranked and compared. There are 32, 517, and 1800 regulatory elements in normal, T cell leukemia and T cell activation respectively whose variance are greater than 2.
Similar articles
- Single-cell chromatin accessibility reveals principles of regulatory variation.
Buenrostro JD, Wu B, Litzenburger UM, Ruff D, Gonzales ML, Snyder MP, Chang HY, Greenleaf WJ. Buenrostro JD, et al. Nature. 2015 Jul 23;523(7561):486-90. doi: 10.1038/nature14590. Epub 2015 Jun 17. Nature. 2015. PMID: 26083756 Free PMC article. - Chromatin Accessibility Landscape of Cutaneous T Cell Lymphoma and Dynamic Response to HDAC Inhibitors.
Qu K, Zaba LC, Satpathy AT, Giresi PG, Li R, Jin Y, Armstrong R, Jin C, Schmitt N, Rahbar Z, Ueno H, Greenleaf WJ, Kim YH, Chang HY. Qu K, et al. Cancer Cell. 2017 Jul 10;32(1):27-41.e4. doi: 10.1016/j.ccell.2017.05.008. Epub 2017 Jun 15. Cancer Cell. 2017. PMID: 28625481 Free PMC article. - ATAC-seq on biobanked specimens defines a unique chromatin accessibility structure in naïve SLE B cells.
Scharer CD, Blalock EL, Barwick BG, Haines RR, Wei C, Sanz I, Boss JM. Scharer CD, et al. Sci Rep. 2016 Jun 1;6:27030. doi: 10.1038/srep27030. Sci Rep. 2016. PMID: 27249108 Free PMC article. - Assay for Transposase-Accessible Chromatin with High-Throughput Sequencing (ATAC-Seq) Protocol for Zebrafish Embryos.
Doganli C, Sandoval M, Thomas S, Hart D. Doganli C, et al. Methods Mol Biol. 2017;1507:59-66. doi: 10.1007/978-1-4939-6518-2_5. Methods Mol Biol. 2017. PMID: 27832532 - Chromatin accessibility: a window into the genome.
Tsompana M, Buck MJ. Tsompana M, et al. Epigenetics Chromatin. 2014 Nov 20;7(1):33. doi: 10.1186/1756-8935-7-33. eCollection 2014. Epigenetics Chromatin. 2014. PMID: 25473421 Free PMC article. Review.
Cited by
- The Impact of Immune System Aging on Infectious Diseases.
Quiros-Roldan E, Sottini A, Natali PG, Imberti L. Quiros-Roldan E, et al. Microorganisms. 2024 Apr 11;12(4):775. doi: 10.3390/microorganisms12040775. Microorganisms. 2024. PMID: 38674719 Free PMC article. Review. - Sex differences in brain cell-type specific chromatin accessibility in schizophrenia.
Roussos P, Ma Y, Girdhar K, Hoffman G, Fullard J, Bendl J. Roussos P, et al. Res Sq [Preprint]. 2024 Apr 4:rs.3.rs-4158509. doi: 10.21203/rs.3.rs-4158509/v1. Res Sq. 2024. PMID: 38645177 Free PMC article. Preprint. - Out of the Silence: Insights into How Genes Escape X-Chromosome Inactivation.
Peeters SB, Posynick BJ, Brown CJ. Peeters SB, et al. Epigenomes. 2023 Nov 23;7(4):29. doi: 10.3390/epigenomes7040029. Epigenomes. 2023. PMID: 38131901 Free PMC article. Review. - Considerations for reproducible omics in aging research.
Singh PP, Benayoun BA. Singh PP, et al. Nat Aging. 2023 Aug;3(8):921-930. doi: 10.1038/s43587-023-00448-4. Epub 2023 Jun 29. Nat Aging. 2023. PMID: 37386258 Free PMC article. Review. - SeATAC: a tool for exploring the chromatin landscape and the role of pioneer factors.
Gong W, Dsouza N, Garry DJ. Gong W, et al. Genome Biol. 2023 May 22;24(1):125. doi: 10.1186/s13059-023-02954-5. Genome Biol. 2023. PMID: 37218013 Free PMC article.
References
- Becich MJ. Information management: moving from test results to clinical information. Clin Leadersh Manag Rev. 2000;14:296–300. - PubMed
LinkOut - more resources
Full Text Sources
Other Literature Sources
Research Materials
