Conformational dynamics of a class C G-protein-coupled receptor - PubMed (original) (raw)
. 2015 Aug 27;524(7566):497-501.
doi: 10.1038/nature14679. Epub 2015 Aug 10.
Affiliations
- PMID: 26258295
- PMCID: PMC4597782
- DOI: 10.1038/nature14679
Conformational dynamics of a class C G-protein-coupled receptor
Reza Vafabakhsh et al. Nature. 2015.
Abstract
G-protein-coupled receptors (GPCRs) constitute the largest family of membrane receptors in eukaryotes. Crystal structures have provided insight into GPCR interactions with ligands and G proteins, but our understanding of the conformational dynamics of activation is incomplete. Metabotropic glutamate receptors (mGluRs) are dimeric class C GPCRs that modulate neuronal excitability, synaptic plasticity, and serve as drug targets for neurological disorders. A 'clamshell' ligand-binding domain (LBD), which contains the ligand-binding site, is coupled to the transmembrane domain via a cysteine-rich domain, and LBD closure seems to be the first step in activation. Crystal structures of isolated mGluR LBD dimers led to the suggestion that activation also involves a reorientation of the dimer interface from a 'relaxed' to an 'active' state, but the relationship between ligand binding, LBD closure and dimer interface rearrangement in activation remains unclear. Here we use single-molecule fluorescence resonance energy transfer to probe the activation mechanism of full-length mammalian group II mGluRs. We show that the LBDs interconvert between three conformations: resting, activated and a short-lived intermediate state. Orthosteric agonists induce transitions between these conformational states, with efficacy determined by occupancy of the active conformation. Unlike mGluR2, mGluR3 displays basal dynamics, which are Ca(2+)-dependent and lead to basal protein activation. Our results support a general mechanism for the activation of mGluRs in which agonist binding induces closure of the LBDs, followed by dimer interface reorientation. Our experimental strategy should be widely applicable to study conformational dynamics in GPCRs and other membrane proteins.
Figures
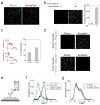
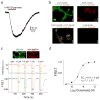
Extended Data Figure 1. Fluorophore labeling is specific and FRET constructs are functional in HEK293T cells
a, SNAP-mGluR2 shows glutamate-induced currents in cells co-expressing GIRK channels. b, Treatment with 2.5 μM benzylguanine Alexa-647 (for SNAP) followed by 5 μM benzylcytosine DY-547 (for CLIP) produces specific and orthogonal labeling of SNAP and CLIP-mGluR2 constructs in HEK293T cells. All conditions were imaged with identical settings in both the red (excitation=635 nm) and green (excitation=561 nm) channels. c, Ensemble FRET measurements from HEK 293T cells. Top, image of cells expressing SNAP and CLIP-mGluR2 labeled with donor (DY-547, green) and acceptor (Alexa-647, red). Bottom, representative trace showing dose-dependent, reversible decrease in FRET upon glutamate application. Glutamate was washed out between applications. d, Ensemble FRET glutamate titration in HEK293T cells. Error bars are s.e.m.
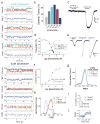
Extended Data Figure 2. Control experiments verifying specificity of the smFRET assay
a, Representative TIRF image showing single receptors in donor and acceptor channels during donor excitation with a 532 nm laser. b, Single molecule pulldown of SNAP-mGluR2 on a passivated surface is specific. Left, representative images of individual molecules in the absence or presence of an anti-mGluR2 antibody. Right, quantification of number of molecules pulled down for each condition. c, Photobleaching step analysis shows that mGluR2 remains a dimer in SiMpull. Left, representative single molecule bleaching steps for mGluR2-GFP. Right, histogram of bleaching step counts for all molecules. Dotted red line shows the predicted proportions for an 80% GFP maturation rate. d, Pulldown of lysate from cells expressing only SNAP-mGluR2 (c) or only CLIP-mGluR2 (d), and labeled with both donor and acceptor fluorophores confirms labeling specificity at the single molecule level. e–f, Pulldown of SNAP- and CLIP-mGluR2 via an antibody against an N-terminal HA-tag (e) leads to very similar smFRET histograms (f, full circles) in the absence (black) or presence of 1 mM glutamate (green) compared to pulldown with a C-terminal antibody (f, open circles). g, Application of either GTP, to remove any co-assembled G proteins, or apyrase, to lock any G proteins onto mGluR2, does not alter smFRET histograms.
Extended Data Figure 3. Further analysis of glutamate-induced smFRET and functional properties of mGluR2
a, Representative smFRET traces for mGluR2 in the presence of 4 μM or 8 μM glutamate. b, Quantification of the percentage of single molecule traces showing at least one transition to the active state at different glutamate concentrations c, In HEK293T cells co-expressing mGluR2 and GIRK, LY341495 prevents glutamate-induced inward currents without altering the baseline current. d, Glutamate titration curves produced from fitting FRET histograms to the sum of 3 Gaussian distributions. e–f, Glutamate induces inward currents via mGluR2 in a dose-dependent manner (n=9 cells). g, The glutamate-insensitive mGluR2-YADA (Y216A, D295A) shows no smFRET response to 50 μM or 1mM glutamate. h, smFRET histograms showing that application of the competitive antagonist LY341495 reverses the FRET change induced by glutamate. i, Dwell time analysis of mGluR2 for sub-saturating glutamate concentrations. j, FRET density plots constructed from synchronized transitions from the low to high FRET states show a short dwell at the medium FRET level (yellow box). Error bars are s.e.m.
Extended Data Figure 4. Further analysis of the effects of orthosteric agonists on mGluR2 smFRET
a, Cross-correlation plot for mGluR2 in the presence of DCG-IV shows concentration dependent dynamics. b–c, smFRET histogram (b) and cross-correlation plots (c) for mGluR2 in the presence of the full agonist LY379268. d, smFRET histograms in the presence of 1μM glutamate, 100 nM DCG-IV and 2 nM LY379268 yields comparable occupancy of the active state. e–f, representative smFRET traces for mGluR2 in the presence of 0.1μM DCG-IV (e) or 2nM LY379268 (f) which are the concentrations used for dwell time analysis. g–h, FRET density plots constructed from the average transitions from the low to high states show a short dwell at the medium FRET level (yellow boxes) for mGluR2 in the presence of DCG-IV (g) or LY379268 (h).
Extended Data Figure 5. TMD mutations that introduce basal activity and a positive allosteric modulator increase the affinity and efficacy of a partial agonist
a, Crystal structures of the mGluR1 TMD bound to a NAM (PDB ID: 4OR2) showing the location of conserved residues in TM4 and TM6 previously shown to be sensitive to mutations that induce basal activity. b, Ensemble FRET titrations showing that mutations Q679V and C770A increase the affinity and efficacy of DCG-IV compared to mGluR2wt. c–d, smFRET histograms for TMD mutants show population of the same 3 FRET states as wt, but with greater occupation of the low FRET state at either sub-saturating (c) or saturating (d) concentrations of DCG-IV. e, Binding of PAM LY487379 to the TMD of mGluR2 (top) increases the apparent affinity and efficacy of DCG-IV in ensemble FRET measurements in HEK 293T cells. All values were normalized to the response to 1 mM glutamate. b, smFRET histograms showing a LY487379 -induced shift in the response to 1 μM DCG-IV. Error bars are s.e.m.
Extended Data Figure 6. Characterization of basic ensemble and smFRET properties of mGluR3 as compared to mGluR2
a, Activation of GIRK by SNAP-mGluR3 in HEK293T cells. b, smFRET histograms for mGluR3 show glutamate-independent low FRET population. c, Cross-correlation plots for mGluR3 show glutamate-independent dynamics. d, Unlike mGluR3, mGluR2 shows zero or minimal current response to the antagonist LY341495 in the absence of glutamate. e–f, Ensemble FRET in HEK293T cells shows a robust antagonist LY341495-induced FRET increase in mGluR3 (e) but not in mGluR2 (f). g**,** smFRET histograms for mGluR3 with or without GTP treatment to dissociate any G proteins that may be coupled to the receptor. The time resolution for this data is 100 ms. Error bars are s.e.m.
Extended Data Figure 7. Calcium sensitivity of mGluR3
a–b, Representative smFRET traces for mGluR3 in the absence (a) or presence (b) of 2 mM Ca2+. c, smFRET histograms for mGluR3 in the presence of various concentrations of calcium. d, Cross-correlation plots for mGluR3 in the presence of various concentrations of calcium. e, FRET density plot for showing that Ca2+ induced synchronized transitions show a similar intermediate in mGluR3, as observed in mGluR2. f–g, smFRET histograms (f) and cross-correlation plots (g) for mGluR2 in the presence of various concentrations of calcium.
Extended Data Figure 8. mGluR3-S152D shows decreased basal FRET and calcium sensitivity
a, Ensemble FRET glutamate titrations for mGluR3 and mGluR3-S152D. b, Representative ensemble FRET trace for mGluR3-S152D shows no response to LY341495. c, Summary of basal FRET for mGluR3, mGluR2, and mGluR3-S152D. Basal FRET=[ΔFRETLY341495]/([ΔFRETLY341495] +[ΔFRETGlu]). d, Representative smFRET traces for mGluR3-S152D in the absence (left) or presence (right) of 2 mM Ca2+. e, smFRET histograms for mGluR3-S152D in the absence or presence of Ca2+ or saturating glutamate. f, Cross-correlation plots for mGluR3-S152D. Inset shows the percentage of traces showing dynamics in different ligand conditions. Error bars are s.e.m.
Extended Data Figure 9. Glutamate induced smFRET dynamics of mGluR3 in the absence of calcium
a, Representative smFRET traces for mGluR3 in the absence of Ca2+ and the presence of sub-saturating glutamate. b, smFRET Histogram showing dose-dependent response of mGluR3 to glutamate in the absence of Ca2+. c, Cross-correlation plots showing glutamate-induced smFRET dynamics. mGluR2 (green) at its maximum dynamics shows a smaller cross-correlation amplitude compared to mGluR3.
Extended Data Figure 10. Further characterization of mGluR2-K240A and WT/YADA heterodimers
a, Crystal structures of mGluR1 in the “relaxed” (top; PDB ID: 1EWT) and “active” states (bottom; PDB ID: IEWK) show a reorientation of the dimer interface that brings charged residues of the lower lobe in close proximity. Conserved negatively charged residues are shown in red and K260 (K240 in mGluR2) is shown in blue. b, Glutamate titrations show a decreased apparent affinity for mGluR2-K240A in ensemble FRET (top) and GIRK current activation (bottom). c, Cross-correlation plots in the presence of saturating glutamate show increased dynamics for mGluR2-K240A relative to wild type. d, smFRET histogram showing distributions for WT/YADA heterodimers at a range of glutamate concentrations. e, Concentration-dependence of low FRET population in WT/YADA heterodimers produced from fitting FRET histograms to the sum of 3 Gaussian distributions. The EC50 for each phase of the distribution is shown. g, Concentration-dependence of medium FRET population in WT/YADA heterodimers and WT homodimers produced from fitting FRET histograms to the sum of 3 Gaussian distributions. g, 3-state fit to FRET histogram for WT/YADA heterodimers in the presence of 100 μM glutamate shows substantial population of the medium FRET (0.35) peak. h, Cross-correlation plots for WT/YADA heterodimers. Error bars are s.e.m.
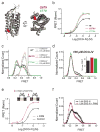
Figure 1. A single molecule FRET assay reveals three conformations of the mGluR2 activation pathway
a, Crystal structures of mGluR1 in the “relaxed” (PDB ID: 1EWT) and “active” states (PDB ID: IEWK) show an increase in the distance between N-termini upon activation. Green and red ovals show the approximate positions of SNAP and CLIP tags. b, Schematic of single molecule FRET measurements. c, Donor (green) and acceptor (red) intensity time traces and FRET trace (blue) in the absence (top) or presence (bottom) of 1 mM glutamate show a decrease in FRET in the presence of saturating glutamate. d, Representative smFRET traces at 4 μM glutamate reveal rapid dynamics between 3 states. A 3 state fit obtained from Hidden Markov analysis is overlaid over the filtered raw data. e, smFRET histograms in the presence of a range of glutamate concentrations or competitive antagonist (LY341495). Blue lines show global 3-component Gaussian fits that show the high (~0.45), medium (~0.35), and low (0.2) FRET states. The sum of all 3 components is shown in red. f, Titration curve for the low FRET peak g, Cross-correlation plots show limited dynamics in the absence of glutamate (black) or in saturating glutamate (1 mM, green), but enhanced dynamics at intermediate concentrations (8 μM, magenta). h, Concentration dependence of low FRET dwell times obtained from dwell time analysis. i, FRET density plots constructed from synchronized transitions from the high to low FRET states show a short dwell at the medium FRET level (yellow box). Error bars are s.e.m.
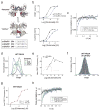
Figure 2. Conformational basis of partial agonism of mGluR2
a, Ensemble FRET titrations in HEK 293T cells expressing mGluR2 in the presence of glutamate (red), DCG-IV (blue) or LY379268 (black). FRET values in each condition are normalized to the response to 1 mM glutamate. b, smFRET histogram for DCG-IV shows the same 3 states as seen for glutamate (dotted lines), with dose-dependent occupancy of the low FRET state. c, Representative smFRET trace shows transitions out of the low FRET state in saturating DCG-IV. d, Cross-correlation plots for saturating agonist reveal dynamics = DCG-IV > glutamate > LY379268. e, smFRET histograms for saturating agonist; occupancy of the low FRET state = DCG-IV < glutamate < LY379268 (inset). f-g, At concentrations that result in comparable population of the active state, LY379268 induces slower dynamics than DCG-IV and glutamate as shown in cross-correlation (f) and representative smFRET traces (g). h, LY379268 induces significantly longer low FRET state dwell times than glutamate and DCG-IV (Two-tailed T-test, P=0.0084). Error bars are s.e.m.
Figure 3. mGluR3 has high basal structural dynamics and activity
a, Representative mGluR3 smFRET traces show basal dynamics in the absence of glutamate (top) that are abolished by the competitive antagonist LY341495 (bottom). b, In HEK293T cells co-expressing GIRK channels, mGluR3 has basal activity in the absence of glutamate, which is blocked by LY341495. c, Basal activity ([ILY341495]/([ILY341495] +[IGlu]) for mGluR2 and mGluR3. Values in parentheses indicate number of cells tested and * indicates significance (unpaired, two-tailed T-Test; p=0.0097). d, smFRET histograms for mGluR3 show occupancy of the low FRET state that is abolished by removal of Ca2+ or introduction of the S152D mutation. e, Representative smFRET traces for mGluR3 in the absence of Ca2+ with either 0 (top) or saturating (bottom) glutamate**. f,** Cross-correlation plots for mGluR3. g–h, Dwell time of the active state for mGluR3 in the presence of glutamate (100 nM) or Ca2+ (2 mM) compared to mGluR2 (4 μM glutamate) (unpaired, two-tailed T-test, p=0.00055). Error bars are s.e.m.
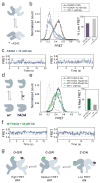
Figure 4. A three-state model of mGluR activation
a–b, Mutation of residue K240 at the lower lobe LBD dimer interface (blue marker) (a) decreases occupancy of the low FRET state at saturating (10 mM) glutamate. (b). c, Representative smFRET traces for K240A in the presence of glutamate show transitions out of the low FRET state. d–e, Heterodimers of WT mGluR2 and the glutamate-insensitive mGluR2 (YADA) mutant (d) show enhanced occupancy of the medium FRET state (e). f, Representative smFRET traces for WT/YADA heterodimers show transitions between the high and medium FRET states with limited visits to the low FRET state. g, Three-state structural model of mGluRs based on intra-subunit (closed “C” to open “O”) and inter-subunit (relaxed “R” to active “A”) conformational changes. Error bars are s.e.m.
Similar articles
- Conformational dynamics between transmembrane domains and allosteric modulation of a metabotropic glutamate receptor.
Gutzeit VA, Thibado J, Stor DS, Zhou Z, Blanchard SC, Andersen OS, Levitz J. Gutzeit VA, et al. Elife. 2019 Jun 7;8:e45116. doi: 10.7554/eLife.45116. Elife. 2019. PMID: 31172948 Free PMC article. - Sequential conformational rearrangements dictate the dynamics of class C GPCR activation.
Lane JR, Canals M. Lane JR, et al. Sci Signal. 2012 Nov 20;5(251):pe51. doi: 10.1126/scisignal.2003503. Sci Signal. 2012. PMID: 23169816 - Fine tuning of sub-millisecond conformational dynamics controls metabotropic glutamate receptors agonist efficacy.
Olofsson L, Felekyan S, Doumazane E, Scholler P, Fabre L, Zwier JM, Rondard P, Seidel CA, Pin JP, Margeat E. Olofsson L, et al. Nat Commun. 2014 Oct 17;5:5206. doi: 10.1038/ncomms6206. Nat Commun. 2014. PMID: 25323157 - Asymmetric activation of dimeric GABAB and metabotropic glutamate receptors.
Liu L, Lin L, Shen C, Rondard P, Pin JP, Xu C, Liu J. Liu L, et al. Am J Physiol Cell Physiol. 2023 Jul 1;325(1):C79-C89. doi: 10.1152/ajpcell.00150.2022. Epub 2023 May 15. Am J Physiol Cell Physiol. 2023. PMID: 37184233 Review. - [Ligand recognition mechanism of G-CSF receptor and metabotropic glutamate receptor].
Morikawa K. Morikawa K. Yakugaku Zasshi. 2002 Nov;122(11):855-68. doi: 10.1248/yakushi.122.855. Yakugaku Zasshi. 2002. PMID: 12440146 Review. Japanese.
Cited by
- Biased Allostery.
Edelstein SJ, Changeux JP. Edelstein SJ, et al. Biophys J. 2016 Sep 6;111(5):902-8. doi: 10.1016/j.bpj.2016.07.044. Biophys J. 2016. PMID: 27602718 Free PMC article. - Structural architecture of a dimeric class C GPCR based on co-trafficking of sweet taste receptor subunits.
Park J, Selvam B, Sanematsu K, Shigemura N, Shukla D, Procko E. Park J, et al. J Biol Chem. 2019 Mar 29;294(13):4759-4774. doi: 10.1074/jbc.RA118.006173. Epub 2019 Feb 5. J Biol Chem. 2019. PMID: 30723160 Free PMC article. - Mechanism of Assembly and Cooperativity of Homomeric and Heteromeric Metabotropic Glutamate Receptors.
Levitz J, Habrian C, Bharill S, Fu Z, Vafabakhsh R, Isacoff EY. Levitz J, et al. Neuron. 2016 Oct 5;92(1):143-159. doi: 10.1016/j.neuron.2016.08.036. Epub 2016 Sep 15. Neuron. 2016. PMID: 27641494 Free PMC article. - Activation of the A2A adenosine G-protein-coupled receptor by conformational selection.
Ye L, Van Eps N, Zimmer M, Ernst OP, Prosser RS. Ye L, et al. Nature. 2016 May 12;533(7602):265-8. doi: 10.1038/nature17668. Epub 2016 May 4. Nature. 2016. PMID: 27144352 - Optogenetic Techniques for Manipulating and Sensing G Protein-Coupled Receptor Signaling.
Abreu N, Levitz J. Abreu N, et al. Methods Mol Biol. 2020;2173:21-51. doi: 10.1007/978-1-0716-0755-8_2. Methods Mol Biol. 2020. PMID: 32651908 Free PMC article. Review.
References
- Conn PJ, Pin JP. Pharmacology and functions of metabotropic glutamate receptors. Annu Rev Pharmacol Toxicol. 1997;37:205–237. - PubMed
Publication types
MeSH terms
Substances
LinkOut - more resources
Full Text Sources
Other Literature Sources
Molecular Biology Databases
Miscellaneous
