Non-muscle myosin IIB is critical for nuclear translocation during 3D invasion - PubMed (original) (raw)
Non-muscle myosin IIB is critical for nuclear translocation during 3D invasion
Dustin G Thomas et al. J Cell Biol. 2015.
Abstract
Non-muscle myosin II (NMII) is reported to play multiple roles during cell migration and invasion. However, the exact biophysical roles of different NMII isoforms during these processes remain poorly understood. We analyzed the contributions of NMIIA and NMIIB in three-dimensional (3D) migration and in generating the forces required for efficient invasion by mammary gland carcinoma cells. Using traction force microscopy and microfluidic invasion devices, we demonstrated that NMIIA is critical for generating force during active protrusion, and NMIIB plays a major role in applying force on the nucleus to facilitate nuclear translocation through tight spaces. We further demonstrate that the nuclear membrane protein nesprin-2 is a possible linker coupling NMIIB-based force generation to nuclear translocation. Together, these data reveal a central biophysical role for NMIIB in nuclear translocation during 3D invasive migration, a result with relevance not only to cancer metastasis but for 3D migration in other settings such as embryonic cell migration and wound healing.
Figures
Figure 1.
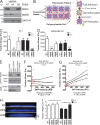
NMIIA is essential for traction force generation during initial adhesion and spreading. (A) NMIIA and NMIIB protein expression levels in 4T1 cells stably infected with NT lentiviral constructs or shRNA constructs to deplete NMIIA or NMIIB. (B) Diagram demonstrating TFM. Fluorescent microbeads are embedded within a PAA gel formed on a glass coverslip. The PAA gel is then coated in a continuous layer of 50 µg/ml fibronectin. Plated cells deform the gel during spreading, moving the embedded beads. The cells are then trypsinized, allowing for the relaxation of the gel and return of the beads to their original position. The distance of bead movement is measured to quantify traction stress. (C) 4T1 cell traction force generation during active spreading. Traction stress was measured every 15 min for 1 h after plating. Representative images of control, NMIIA-shRNA, and NMIIB-shRNA cells during the spreading time course are shown. Representative traction stress heat maps (top) and their corresponding phase-contrast image (bottom) are shown. (D) Traction stresses are quantified by averaging the magnitude of all calculated vectors within the area of the cell outline. The mean of the per cell average traction stress was quantified. Error bars are SEM; n = 20 cells.
Figure 2.
NMIIB is critical for traction force generation in fully spread, nonmigrating cells. (A) NMIIA and NMIIB protein expression levels in MDA-MB231 cells stably infected with lentiviral shRNA constructs to deplete NMIIA or NMIIB. (B) Diagram showing measurement of traction stress, a measure of force generation for cells attached to 30-µm2 patterned squares of fibronectin. Cells were plated and allowed to adhere for 1 or 16 h, and bead positions were imaged before and after trypsin treatment to determine contractile stresses. (C and D) Traction stress measurements were collected on NT shRNA control, NMIIA-shRNA, or NMIIB-shRNA 4T1 cells (C) or MDA-MB-231 cells (D) at 1 h (open bars) and 16 h (closed bars). *, P < 0.01; ***, P < 0.0001; n = 30 cells per condition; error bars represent SEM. (E) MDA-MB 231 were transiently transfected with either a NMIIB-GFP fusion construct or a control-free GFP construct and expression was verified via Western blot. (F and G) MDA-MB 231 NMIIB-shRNA cells were transfected with a GFP-NMIIB fusion construct and traction stress was measured on patterned fibronectin at 1 h (F) or 16 h (G) after plating. GFP intensity of individual cells was quantified and correlated with levels of traction stress. Dashed lines represent 95% confidence interval; n = 21 and 33 for 1 and 16 h time points, respectively. (H and I) MDA-MB 231 cells were plated on fibronectin-coated coverglass for 1 or 16 h before fixation and DAPI staining. They were then analyzed by spinning-disk confocal microscopy to generate x–z projections for nuclear height quantification. (H) Representative x–z projection DAPI images of MDA-MB 231 control, NMIIA shRNA, or NMIIB shRNA at 16-h time point. Vertical bar, 5 µm. (I) Nuclear height among conditions is unchanged at 1 h (open bars). NMIIB knockdown significantly increased nuclear height, whereas NMIIA knockdown had no effect compared with control at 16 h (shaded bars). **, P < 0.01; ***, P < 0.0001; n = 60 cells per condition.
Figure 3.
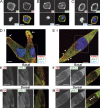
NMIIA is enriched in protrusions and active NMIIB localizes to dorsal perinuclear fibers. MDA-MB 231 cells fixed and immunostained 1 h after plating for NMIIA and NMIIB (A), NMIIA and pMLC (B), or NMIIB and pMLC (C). (D, i) MDA-MB 231 cells fixed and stained for NMIIA and NMIIB 16 h after plating. Dashed box indicates field for ii and iii. NMIIA is enriched in protrusions and NMIIB is enriched in lateral stress fibers (arrows). (D, ii) NMIIA forms basal perinuclear stress fibers. (D, iii) Dorsal localization of NMIIA and NMIIB. (E, i) MDA-MB 231 cell fixed and stained for NMIIB and pMLC 16 h after plating. Dashed box indicates field for ii and iii. NMIIB colocalizes with pMLC in basal perinuclear stress fibers (ii) and in dorsal stress fibers (iii, arrowheads). Bars, 10 µm.
Figure 4.
Perinuclear localization of NMIIB is not dependent on formation of NMIIA fibers. (A) MDA-MB 231 NT shRNA control or NMIIA shRNA cells were plated on fibronectin-coated coverglass and fixed at 1, 2, or 16 h and stained for NMIIB and pMLC. Arrowheads indicate lateral stress fibers of NMIIB. Dashed boxes indicate region of detail for B. (B) Details of boxes from A. Activated NMIIB fibers in both control and NMIIA shRNA cells were observed below and above the nucleus. All images were acquired with identical parameters, and contrast enhancements were all performed identically. Bars, 10 µm.
Figure 5.
NMIIA and NMIIB are critical for invasion through 3D collagen gels. (A) Representative x–z projection images of Vybrant DiI fluorescently labeled MDA-MB 231 cells. Dashed line marks 20-µm distance from bottom. Bars, 50 µm. Invasiveness was quantified via confocal z-section analysis, where extent of invasion is scored as the fraction of cells that invade >20 µm into the gel during a 24-h invasion assay. (B) Quantification of invasion of 4T1 cells through 5.8 mg/ml of collagen gel during 24-h incubation. (C) Quantification of invasion of MDA-MB 231 cells through 5.8 mg/ml of collagen gel. MDA-MB-231 cells were co-cultured with nonfluorescent macrophages to enhance invasiveness (Goswami et al., 2005). 4T1 cells were cultured in the absence of macrophages. (D) GFP-NMIIB expression in MDA-MB 231 cells rescued invasion through 3D collagen gels to control levels. Data were compiled from three independent replicates; n = 15–30 fields analyzed per condition. Error bars indicate SEM; *, P < 0.05; **, P < 0.01; ***, P < 0.001 as compared with control.
Figure 6.
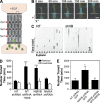
NMIIB facilitates nuclear translocation through restrictive pores. (A) Schematic showing 3D chemotactic invasion chamber. Cells are seeded in the lower chamber in the diagram, and a chemoattractant gradient is established with 200 ng/ml EGF-containing media in the opposite chamber. Time-lapse images are then collected and the time of nuclear transit through restrictive pores is measured via kymograph analysis. White arrowhead indicates nonrestrictive control channel. White arrow indicates direction of cellular migration. (B) Representative time course images of an MDA-MB 231 cell expressing a Histone2B–CFP nuclear marker passing through a 5 × 5-µm2 pore. The white dashed line in each frame represents the position used for kymograph generation. Bar, 50 µm. (C) Representative kymographs showing time courses of nuclei passing through multiple parallel channels (individual channels denoted by arrowheads) of an invasion chamber. MDA-MB 231 NT shRNA control cells (left) have a shorter nuclear retention in the pore, as compared with NMIIB knockdown cells (right). Vertical bar, 120 min. (D) Quantification of nuclear transit time. *, P < 0.05; ***, P < 0.0001 relative to NT control. Nuclear transit through 5-µm-wide restrictions in shaded bars and unrestricted nuclear transit in open bars. n = 60 to 100 nuclei analyzed per condition. (E) GFP-NMIIB transfection rescues efficient nuclear transit through 3D microfluidic invasion devices to control levels. Error bars indicate SEM; *, P < 0.05.
Figure 7.
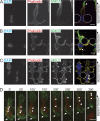
NMIIB localizes to the rear and perinuclear region of cells migrating through 3D environments. MDA-MB 231 cells were fixed and stained as they migrated through restriction points of the 3D migration devices. Dotted lines indicate positions of posts that create 5-µm pores. (A) Cells were stained for NMIIA and F-actin (phalloidin). Arrowhead marks leading edge where a high concentration of NMIIA can be observed. (B) Cells are stained for NMIIB and phalloidin. Arrowhead marks NMIIB localization in trailing edge. (C) Cells are stained for pMLC and phalloidin. Arrowheads mark perinuclear stress fibers containing pMLC. (D) Images from time-lapse showing MDA-MB 231 cell expressing nuclear marker H2B-RFP (red) and GFP-NMIIB (green) as it migrates through a 5-µm-wide restriction pore. Arrowheads indicate stress fibers above the nucleus containing GFP-NMIIB and arrows indicate posterior NMIIB accumulation. Bars, 10 µm.
Figure 8.
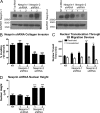
Nesprin-2 knockdown recapitulates NMIIB shRNA phenotype. (A) Western blot of nesprin-1 or -2 expression levels. MDA-MB 231 cells were infected with lentivirus expressing shRNA sequences of either NT control, nesprin-1 shRNA targets, or nesprin-2 shRNA targets. To account for off-target effects, two separate constructs were used for nesprin-1 and -2. (B) Collagen invasion of nesprin-1 or -2 shRNA cells (n = 16 fields analyzed). (C) Nuclear translocation time of H2B-RFP–labeled nuclei through 5-µm-wide pores (shaded bars), compared with nonrestrictive control channels (open bars) of 3D migration devices (n = 30–50 nuclei). (D) Nuclear height of nesprin knockdown cells measured from x–z projections of DAPI-stained nuclei (n = 60–70 nuclei). Error bars represent SEM. **, P < 0.01; ***, P < 0.001.
Similar articles
- Differential contributions of nonmuscle myosin IIA and IIB to cytokinesis in human immortalized fibroblasts.
Yamamoto K, Otomo K, Nemoto T, Ishihara S, Haga H, Nagasaki A, Murakami Y, Takahashi M. Yamamoto K, et al. Exp Cell Res. 2019 Mar 1;376(1):67-76. doi: 10.1016/j.yexcr.2019.01.020. Epub 2019 Jan 31. Exp Cell Res. 2019. PMID: 30711568 - Endogenous species of mammalian nonmuscle myosin IIA and IIB include activated monomers and heteropolymers.
Shutova MS, Spessott WA, Giraudo CG, Svitkina T. Shutova MS, et al. Curr Biol. 2014 Sep 8;24(17):1958-68. doi: 10.1016/j.cub.2014.07.070. Epub 2014 Aug 14. Curr Biol. 2014. PMID: 25131674 Free PMC article. - Nonmuscle myosin IIA and IIB differentially contribute to intrinsic and directed migration of human embryonic lung fibroblasts.
Kuragano M, Murakami Y, Takahashi M. Kuragano M, et al. Biochem Biophys Res Commun. 2018 Mar 25;498(1):25-31. doi: 10.1016/j.bbrc.2018.02.171. Epub 2018 Feb 24. Biochem Biophys Res Commun. 2018. PMID: 29486156 - Smart mechanosensing machineries enable migration of vascular smooth muscle cells in atherosclerosis-relevant 3D matrices.
Chi Q, Shan J, Ding X, Yin T, Wang Y, Jia D, Wang G. Chi Q, et al. Cell Biol Int. 2017 Jun;41(6):586-598. doi: 10.1002/cbin.10764. Epub 2017 Apr 11. Cell Biol Int. 2017. PMID: 28328100 Review. - Common and Specific Functions of Nonmuscle Myosin II Paralogs in Cells.
Shutova MS, Svitkina TM. Shutova MS, et al. Biochemistry (Mosc). 2018 Dec;83(12):1459-1468. doi: 10.1134/S0006297918120040. Biochemistry (Mosc). 2018. PMID: 30878021 Free PMC article. Review.
Cited by
- A Chemomechanical Model for Nuclear Morphology and Stresses during Cell Transendothelial Migration.
Cao X, Moeendarbary E, Isermann P, Davidson PM, Wang X, Chen MB, Burkart AK, Lammerding J, Kamm RD, Shenoy VB. Cao X, et al. Biophys J. 2016 Oct 4;111(7):1541-1552. doi: 10.1016/j.bpj.2016.08.011. Biophys J. 2016. PMID: 27705776 Free PMC article. - Computational estimates of mechanical constraints on cell migration through the extracellular matrix.
Maxian O, Mogilner A, Strychalski W. Maxian O, et al. PLoS Comput Biol. 2020 Aug 27;16(8):e1008160. doi: 10.1371/journal.pcbi.1008160. eCollection 2020 Aug. PLoS Comput Biol. 2020. PMID: 32853248 Free PMC article. - Multiple mechanisms of 3D migration: the origins of plasticity.
Petrie RJ, Yamada KM. Petrie RJ, et al. Curr Opin Cell Biol. 2016 Oct;42:7-12. doi: 10.1016/j.ceb.2016.03.025. Epub 2016 Apr 12. Curr Opin Cell Biol. 2016. PMID: 27082869 Free PMC article. Review. - Mechanical Regulation of Nuclear Translocation in Migratory Neurons.
Nakazawa N, Kengaku M. Nakazawa N, et al. Front Cell Dev Biol. 2020 Mar 12;8:150. doi: 10.3389/fcell.2020.00150. eCollection 2020. Front Cell Dev Biol. 2020. PMID: 32226788 Free PMC article. Review. - Nesprin-2G, a Component of the Nuclear LINC Complex, Is Subject to Myosin-Dependent Tension.
Arsenovic PT, Ramachandran I, Bathula K, Zhu R, Narang JD, Noll NA, Lemmon CA, Gundersen GG, Conway DE. Arsenovic PT, et al. Biophys J. 2016 Jan 5;110(1):34-43. doi: 10.1016/j.bpj.2015.11.014. Biophys J. 2016. PMID: 26745407 Free PMC article.
References
- Aslakson C.J., and Miller F.R.. 1992. Selective events in the metastatic process defined by analysis of the sequential dissemination of subpopulations of a mouse mammary tumor. Cancer Res. 52:1399–1405. - PubMed
- Beach J.R., Hussey G.S., Miller T.E., Chaudhury A., Patel P., Monslow J., Zheng Q., Keri R.A., Reizes O., Bresnick A.R., et al. . 2011. Myosin II isoform switching mediates invasiveness after TGF-β–induced epithelial–mesenchymal transition. Proc. Natl. Acad. Sci. USA. 108:17991–17996. 10.1073/pnas.1106499108 - DOI - PMC - PubMed
Publication types
MeSH terms
Substances
Grants and funding
- GM50009/GM/NIGMS NIH HHS/United States
- R01 NS059348/NS/NINDS NIH HHS/United States
- U54CA143876/CA/NCI NIH HHS/United States
- R01 GM050009/GM/NIGMS NIH HHS/United States
- R01 CA129359/CA/NCI NIH HHS/United States
- CA129359/CA/NCI NIH HHS/United States
- U54 CA143876/CA/NCI NIH HHS/United States
- R25CA1485052-02/CA/NCI NIH HHS/United States
- R01 HL082792/HL/NHLBI NIH HHS/United States
LinkOut - more resources
Full Text Sources
Other Literature Sources
Molecular Biology Databases
Miscellaneous

