FLT1 signaling in metastasis-associated macrophages activates an inflammatory signature that promotes breast cancer metastasis - PubMed (original) (raw)
. 2015 Aug 24;212(9):1433-48.
doi: 10.1084/jem.20141555. Epub 2015 Aug 10.
Hui Zhang 2, Jiufeng Li 2, Tianfang He 2, Eun-Jin Yeo 3, Daniel Y H Soong 4, Neil O Carragher 4, Alison Munro 4, Alvin Chang 2, Anne R Bresnick 2, Richard A Lang 3, Jeffrey W Pollard 5
Affiliations
- PMID: 26261265
- PMCID: PMC4548055
- DOI: 10.1084/jem.20141555
FLT1 signaling in metastasis-associated macrophages activates an inflammatory signature that promotes breast cancer metastasis
Bin-Zhi Qian et al. J Exp Med. 2015.
Abstract
Although the link between inflammation and cancer initiation is well established, its role in metastatic diseases, the primary cause of cancer deaths, has been poorly explored. Our previous studies identified a population of metastasis-associated macrophages (MAMs) recruited to the lung that promote tumor cell seeding and growth. Here we show that FMS-like tyrosine kinase 1 (Flt1, also known as VEGFR1) labels a subset of macrophages in human breast cancers that are significantly enriched in metastatic sites. In mouse models of breast cancer pulmonary metastasis, MAMs uniquely express FLT1. Using several genetic models, we show that macrophage FLT1 signaling is critical for metastasis. FLT1 inhibition does not affect MAM recruitment to metastatic lesions but regulates a set of inflammatory response genes, including colony-stimulating factor 1 (CSF1), a central regulator of macrophage biology. Using a gain-of-function approach, we show that CSF1-mediated autocrine signaling in MAMs is downstream of FLT1 and can restore the tumor-promoting activity of FLT1-inhibited MAMs. Thus, CSF1 is epistatic to FLT1, establishing a link between FLT1 and inflammatory responses within breast tumor metastases. Importantly, FLT1 inhibition reduces tumor metastatic efficiency even after initial seeding, suggesting that these pathways represent therapeutic targets in metastatic disease.
© 2015 Qian et al.
Figures
Figure 1.
Stromal FLT1 is important for breast cancer pulmonary metastasis. (a) Total tumor burden of PyMT; Flt1tk/+ or PyMT; Flt1tk/tk mice at 19 wk of age. (b) Representative H&E-stained section of lung metastasis nodules of PyMT; Flt1tk/+ (top) or PyMT; Flt1tk/tk mice (bottom; arrowheads). (c) Stereological quantification of lung metastasis index at 19 wk of age. Mets index is equal to total metastasis volume normalized by total lung volume. Bars show median with interquartile range; n ≥ 12; ***, P < 0.001 by Mann-Whitney test. (d) Quantification of circulating tumor cell number by relative PyMT gene expression in CD45-circulating cells in age-matched littermate mice bearing late stage tumors. Bars represent median ± interquartile range; n = 12; not significant by Mann-Whitney test. (e) BMMs induce Met-1 cell invasion in a modified transwell invasion assay, whereas Flt1tk/tk macrophages show no difference compared with WT macrophages. Error bars indicate SEM. n = 3 with duplicate; *, P < 0.05; not significant between WT and Flt1tk/tk BMM by one-way ANOVA with Tukey’s multiple comparison. (f) Spontaneous metastasis of E0771 cells in littermate heterozygous or homozygous for Flt1tk targeted mutation. (g) Representative automatically stitched scanned images of H&E-stained lung cross section. (b and g) Bars, 1 mm. (h) Stereological quantification of mice harvested at 8 wk. Metastasis quantification was the same as in c. Mean + SEM; n = 9; *, P < 0.05 by Mann-Whitney test. (i) Survival curve of mice left to monitor. Death is defined as time the mice became moribund; n ≥ 13; P = 0.022 by log-rank test. (j–l) Stereological quantification of the distal metastasis efficiency of Met-1 cells in mice heterozygous or homozygous for Flt1tk targeted mutation. Mets index (j) was the same as in c; metastasis number index (k) is equal to averaged number of metastasis sites per square millimeter lung area; average diameter (l) is the averaged size of metastasis nodules in millimeters. Bars represent mean ± SEM. n ≥ 8; **, P < 0.01; ***, P < 0.001 by Student’s t test.
Figure 2.
FLT1 tyrosine kinase domain is critical for human breast tumor cell metastasis. (a–d) Experimental metastasis of 4173 cells in Rag2−/− littermate heterozygous or homozygous for Flt1tk targeted mutation with stereological quantification. (e–h) Distal metastasis efficiency of 4173 cells in bone marrow mosaic nude mice with littermate donor of Rag2−/−; Flt1tk/+ or Rag2−/−; Flt1tk/tk mice with stereological quantification. Metastasis quantification was the same as in Fig. 1. Data show mean + SEM. n ≥ 5; *, P < 0.05; **, P < 0.01 by Student’s t test.
Figure 3.
Macrophage-specific FLT1 knockout inhibits human breast tumor cell distal metastasis. (a) Experimental metastasis assay of 4173 cells in nude mice with macrophage-specific _Csf1r-iCre_–induced Flt1 knockout and Cre− littermate controls. (b and c) Representative H&E-stained lung section of lung metastasis in the indicated mice. (d–f) Stereological quantification of the distal metastasis efficiency of 4173 cells in macrophage-specific Flt1 knockout and littermate control. Metastasis quantification was the same as in Fig. 1. Data show mean + SEM. n ≥ 5; *, P < 0.05; **, P < 0.01 by Student’s t test. (g) Representative micrographs showing colocalization of immunofluorescently stained FLT1 with macrophage markers using anti-CD68 (top) and CD163 (bottom) antibodies in patient-derived breast tumor samples. (h) Representative FLT1 (top) and CD68 (bottom) immunohistochemistry staining–labeled tumor stroma in breast cancer metastasis samples. Bars: (b and c) 1 mm; (g) 20 µm; (h) 100 µm. (i) Number of cases of FLT1-positive (+) and FLT1-negative (-) macrophage-like stroma in primary and metastatic breast cancer samples. P is calculated with Fisher’s exact test.
Figure 4.
FLT1 inhibition blocks breast cancer metastatic growth. (a) Schematic of experimental metastasis assay of Met-1 cells in syngeneic FVB mice with control antibody and FLT1 inhibitory antibody (MF1) treatment started at the indicated time related to tumor cell inoculation. (b–d) Stereological quantification of the distal metastasis efficiency of Met-1 cells with control and MF1 treatment. Metastasis quantification was the same as in Fig. 1. Mean + SEM. n ≥ 5; *, P < 0.05; **, P < 0.01 by ANOVA plus Dunnett’s multiple comparison test. (e and f) Representative snapshots of 3D reconstructed confocal images of tumor cell (CFP, shown in blue) and macrophage (GFP, shown in green) 24 h after tumor cell tail vein injection in mice treated with control antibody (e) and MF1 (f). Bars, 200 µm. (g) Quantification of percentage of tumor cells that have extravasated 24 h after tail vein injection. Error bars indicate SEM. n = 3; not significant by Student’s t test. (h) Apoptosis index, defined by percentage of TUNEL-positive tumor cells, in Met-1 cell lung metastasis with 2-d antibody treatment. Data show mean + SEM. n ≥ 3; **, P < 0.01 by ANOVA plus Dunnett’s multiple comparison test. (i) Proliferation index defined by percentage of Ki67-positive cells in total tumor cells. Data are shown as mean + SEM. n = 4; not significant by one-way ANOVA.
Figure 5.
FLT1 inhibition blocks breast cancer metastatic growth. (a) Spontaneous metastasis assay of F246-6 cells with antibody treatment after tumor resection. (b) Stereological quantification of metastasis index (the same as in Fig. 1). Data show mean + SEM. n ≥ 13; **, P < 0.01 by Student’s t test. (c) Survival curve of mice treated with control or MF1 antibodies. Death is defined when the mice became moribund. n ≥ 10; P = 0.0136 by log-rank test. (d) Representative immunohistograms of the indicated immune cell type showing fluorescent intensity of FLT1 (red) and isotype control (blue) staining. n = 3. (e) Mean fluorescent intensity of FLT1 expression in MAMs and lung-resident macrophages. n = 3; ***, P < 0.001 using two-way ANOVA followed by Šídák’s multiple comparisons test. (f) Percentage of MAMs (F4/80+CD11b+ and Gr1−) in total hematopoietic cells in perfused lung 24 h after Ctrl Ab or MF1 administration. n ≥ 3; not significant by Student’s t test. (g) Percentage of major immune cell populations in total hematopoietic cells in perfused lungs 24 h after Ctrl Ab or MF1 administration. n = 3; not significant by Student’s t test. (e–g) Error bars indicate SEM. (h) Representative Western blot after IP of FLT1 and probing using the p-Tyr antibody in primary macrophages showing phospho-FLT1 (top) and total FLT1 (bottom) treated with the indicated growth factor or tumor cell condition medium. n = 3.
Figure 6.
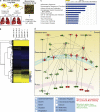
Transcriptome analysis of FLT1-regulated genes in MAMs. (a) Schematic illustration of microarray transcriptome analysis of FACS-sorted MAMs with control treatment (Ctrl Ab) and FLT1 inhibition (MF1). (b) Hierarchical clustering of FLT1-regulated transcripts distinguishes MAM samples with and without FLT1 inhibition. (c) Top 10 enriched function groups of differentially regulated genes in MAMs with FLT1 inhibition based on IPA. (d) Graphical representation of the molecular relationships of the inflammatory response function group genes enriched in FLT1-regulated transcripts. Molecules are represented as nodes, with the color indicating up (red)- or down-regulation (green) by FLT1 inhibition, and the shape represents the functional class of the gene product as indicated below. The biological relationship between two nodes is represented as a line (solid line: direct interaction, broken line: nondirect interaction). Asterisks indicate CSF1 as one of the gene products that has the most interaction with other gene products in the function group. All interactions are supported by references from the literature in the Ingenuity Knowledge Base.
Figure 7.
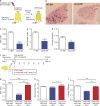
FLT1-regulated CSF1 expression promotes breast tumor cell distal metastasis. (a) Schematic of experimental metastasis assay of Met-1 cells in mosaic mice of bone marrow CSF1-deficient and WT control. (b–e) Representative H&E-stained lung sections (b) and stereological quantification (c–e) of metastatic potential of Met-1 cells in bone marrow mosaic mice as shown in a. Csf1 WT bone marrow (+/+, white bars) and homozygous null mutant bone marrow (op/op, blue bars) are shown. Error bars indicate SEM. n = 7; **, P < 0.01; ***, P < 0.001 by Student’s t test. Bar, 1 mm. (f) Schematic of metastasis assay of Met-1 cells with control antibody, FLT1 inhibition (MF1 treatment), and lung-specific doxycycline-inducible CSF1 expression. (g–i) Metastatic potential of Met-1 cells in mice as shown in f. Induced CSF1 expression with MF1 treatment (Ccsp-rTta +; tetO-Csf1, red bars) and littermate control (Ccsp-rTta −; tetO-Csf1, with control antibody [white bars] or with MF1 [blue bars]). Metastasis quantification was the same as in Fig. 1. Data show mean + SEM. n ≥ 6; ***, P < 0.001 by one-way ANOVA plus Tukey’s multiple comparison.
Figure 8.
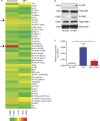
FLT1-regulated CSF1 expression through p-FAK1. (a) Efficacy of FLT1 blockade using MF1 antibody against a panel of 45 proteins and phosphor-proteins on a reverse protein array. Color bar shows relative expression value (global normalization, refer to
Table S1
for epitope information). Phosphorylation of p38 and FAK1 show the most notable reduction upon FLT1 blockade using MF1 antibody. n = 2. (b) Western blot showing inhibition of phosphor-p38 and phosphor-FAK1 in BMMs from littermate mice heterozygous or homozygous for Flt1tk. Representative blot from two independent experiments. (c) FAK1 inhibitor blocks tumor cell–conditioned medium (CM)–induced mRNA Csf1 expression in BMMs. Data show mean + SEM. n = 3; *, P < 0.05 by ANOVA plus Dunnett’s multiple comparison test.
Similar articles
- Loss of Caveolin-1 in Metastasis-Associated Macrophages Drives Lung Metastatic Growth through Increased Angiogenesis.
Celus W, Di Conza G, Oliveira AI, Ehling M, Costa BM, Wenes M, Mazzone M. Celus W, et al. Cell Rep. 2017 Dec 5;21(10):2842-2854. doi: 10.1016/j.celrep.2017.11.034. Cell Rep. 2017. PMID: 29212030 Free PMC article. - Interleukin 4 Controls the Pro-Tumoral Role of Macrophages in Mammary Cancer Pulmonary Metastasis in Mice.
Rodriguez-Tirado C, Entenberg D, Li J, Qian BZ, Condeelis JS, Pollard JW. Rodriguez-Tirado C, et al. Cancers (Basel). 2022 Sep 5;14(17):4336. doi: 10.3390/cancers14174336. Cancers (Basel). 2022. PMID: 36077870 Free PMC article. - NCOA1 Directly Targets M-CSF1 Expression to Promote Breast Cancer Metastasis.
Qin L, Wu YL, Toneff MJ, Li D, Liao L, Gao X, Bane FT, Tien JC, Xu Y, Feng Z, Yang Z, Xu Y, Theissen SM, Li Y, Young L, Xu J. Qin L, et al. Cancer Res. 2014 Jul 1;74(13):3477-88. doi: 10.1158/0008-5472.CAN-13-2639. Epub 2014 Apr 25. Cancer Res. 2014. PMID: 24769444 Free PMC article. - Premetastatic lung "niche": is vascular endothelial growth factor receptor 1 activation required?
Duda DG, Jain RK. Duda DG, et al. Cancer Res. 2010 Jul 15;70(14):5670-3. doi: 10.1158/0008-5472.CAN-10-0119. Epub 2010 Jun 29. Cancer Res. 2010. PMID: 20587530 Free PMC article. Review. - Therapeutic potential of chemokine signal inhibition for metastatic breast cancer.
Kitamura T, Pollard JW. Kitamura T, et al. Pharmacol Res. 2015 Oct;100:266-70. doi: 10.1016/j.phrs.2015.08.004. Epub 2015 Aug 11. Pharmacol Res. 2015. PMID: 26275794 Free PMC article. Review.
Cited by
- Role of monocyte recruitment in hemangiosarcoma metastasis in dogs.
Regan DP, Escaffi A, Coy J, Kurihara J, Dow SW. Regan DP, et al. Vet Comp Oncol. 2017 Dec;15(4):1309-1322. doi: 10.1111/vco.12272. Epub 2016 Oct 25. Vet Comp Oncol. 2017. PMID: 27779362 Free PMC article. - ACGH detects distinct genomic alterations of primary intrahepatic cholangiocarcinomas and matched lymph node metastases and identifies a poor prognosis subclass.
Jansen R, Moehlendick B, Bartenhagen C, Tóth C, Lehwald N, Stoecklein NH, Knoefel WT, Lachenmayer A. Jansen R, et al. Sci Rep. 2018 Jul 13;8(1):10637. doi: 10.1038/s41598-018-28941-6. Sci Rep. 2018. PMID: 30006612 Free PMC article. - A network pharmacology-based investigation of emodin against pancreatic adenocarcinoma.
Shi X, Huang B, Zhu J, Yamaguchi T, Hu A, Tabuchi M, Watanabe D, Yoshikawa S, Mizushima S, Mizushima A, Xia S. Shi X, et al. Medicine (Baltimore). 2023 May 19;102(20):e33521. doi: 10.1097/MD.0000000000033521. Medicine (Baltimore). 2023. PMID: 37335741 Free PMC article. - Reactive myelopoiesis and FX-expressing macrophages triggered by chemotherapy promote cancer lung metastasis.
Wu C, Zhong Q, Shrestha R, Wang J, Hu X, Li H, Rouchka EC, Yan J, Ding C. Wu C, et al. JCI Insight. 2023 May 8;8(9):e167499. doi: 10.1172/jci.insight.167499. JCI Insight. 2023. PMID: 36976637 Free PMC article. - Metastatic site-specific polarization of macrophages in intracranial breast cancer metastases.
Rippaus N, Taggart D, Williams J, Andreou T, Wurdak H, Wronski K, Lorger M. Rippaus N, et al. Oncotarget. 2016 Jul 5;7(27):41473-41487. doi: 10.18632/oncotarget.9445. Oncotarget. 2016. PMID: 27203741 Free PMC article.
References
- Borowsky A.D., Namba R., Young L.J., Hunter K.W., Hodgson J.G., Tepper C.G., McGoldrick E.T., Muller W.J., Cardiff R.D., and Gregg J.P.. 2005. Syngeneic mouse mammary carcinoma cell lines: two closely related cell lines with divergent metastatic behavior. Clin. Exp. Metastasis. 22:47–59. 10.1007/s10585-005-2908-5 - DOI - PubMed
Publication types
MeSH terms
Substances
Grants and funding
- P01 CA100324/CA/NCI NIH HHS/United States
- 101067/WT_/Wellcome Trust/United Kingdom
- R01 CA172451/CA/NCI NIH HHS/United States
- 01067/Z/13/Z/WT_/Wellcome Trust/United Kingdom
- P01CA100324/CA/NCI NIH HHS/United States
- R01 EY021636/EY/NEI NIH HHS/United States
- G1002033/MRC_/Medical Research Council/United Kingdom
- P30 CA013330/CA/NCI NIH HHS/United States
- 17367/CRUK_/Cancer Research UK/United Kingdom
- R01 CA131270/CA/NCI NIH HHS/United States
LinkOut - more resources
Full Text Sources
Other Literature Sources
Medical
Molecular Biology Databases
Research Materials
Miscellaneous

