α-Klotho Expression in Human Tissues - PubMed (original) (raw)
. 2015 Oct;100(10):E1308-18.
doi: 10.1210/jc.2015-1800. Epub 2015 Aug 17.
Arnoud Groen 1, Guerman Molostvov 1, Tzongshi Lu 1, Kathryn S Lilley 1, David Snead 1, Sean James 1, Ian B Wilkinson 1, Stephen Ting 1, Li-Li Hsiao 1, Thomas F Hiemstra 1, Daniel Zehnder 1
Affiliations
- PMID: 26280509
- PMCID: PMC4596032
- DOI: 10.1210/jc.2015-1800
α-Klotho Expression in Human Tissues
Kenneth Lim et al. J Clin Endocrinol Metab. 2015 Oct.
Abstract
Context: α-Klotho has emerged as a powerful regulator of the aging process. To date, the expression profile of α-Klotho in human tissues is unknown, and its existence in some human tissue types is subject to much controversy.
Objective: This is the first study to characterize systemwide tissue expression of transmembrane α-Klotho in humans. We have employed next-generation targeted proteomic analysis using parallel reaction monitoring in parallel with conventional antibody-based methods to determine the expression and spatial distribution of human α-Klotho expression in health.
Results: The distribution of α-Klotho in human tissues from various organ systems, including arterial, epithelial, endocrine, reproductive, and neuronal tissues, was first identified by immunohistochemistry. Kidney tissues showed strong α-Klotho expression, whereas liver did not reveal a detectable signal. These results were next confirmed by Western blotting of both whole tissues and primary cells. To validate our antibody-based results, α-Klotho-expressing tissues were subjected to parallel reaction monitoring mass spectrometry (data deposited at ProteomeXchange, PXD002775) identifying peptides specific for the full-length, transmembrane α-Klotho isoform.
Conclusions: The data presented confirm α-Klotho expression in the kidney tubule and in the artery and provide evidence of α-Klotho expression across organ systems and cell types that has not previously been described in humans.
Figures
Figure 1.
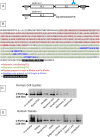
α-Klotho isoforms, sequence, and Western blot. A, Structure of the two isoforms of α-Klotho. Isoform 1 represents the full-length protein and contains a signal sequence domain (SS), two homologous domains (KL1, KL2), a short transmembrane domain (TM), and a short cytoplasmic tail. Shown is the site of the epitope for the antibody used in our experiments: AA 800 to 900, KL2. This epitope is absent from Isoform 2, a soluble, secreted protein that arises from alternative RNA splicing and contains only AA 1–549, and where the terminal 15 residues are replaced by the sequence shown. B, The full-length α-Klotho protein sequence of 1012 AA is shown, with KL1 and KL2 shown in red and green respectively, and TM highlighted (black). The peptides giving rise to the PRM signature are also shown (bold typeface; common to isoforms 1 and 2, red; exclusive to full-length α-Klotho, isoform 1, blue). C and D, Western blot analysis of cell lysates (C) and tissues (D) supports the presence of the full-length α-Klotho. Full-length rh α-Klotho protein (rh-α-Klotho). EC, epithelial cells.
Figure 2.
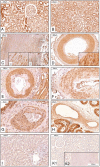
α-Klotho protein expression and distribution in human kidney, artery, and liver. IHC, positive staining (brown) was found in tubular cells of the kidney cortex (A), with variable expression in proximal and stronger expression in distal tubules; medulla (B); the smooth muscle cell layers of artery such as aorta (C) with staining of intima and media (C1) and stronger staining of the vasa vasorum (arrows, C2); and lumen indicated by star. D, Renal artery. E, Intrarenal artery, here with intimal changes probably due to hypertensive vascular changes, F–G, Artery in thyroid (F), prostate (G). and testis (H). I, Hepatocytes did not show any positive staining for α-Klotho protein. K, Negative kidney tissue control (K1) and aorta (K2) with isotype antibody control. n ≥ 5 for each tissue.
Figure 3.
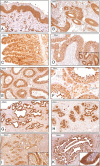
α-Klotho protein expression and distribution in human epithelial and reproductive tissues. IHC, positive staining (brown) was found in all the cellular layers of the epidermis (A) and appendage tissue such as hair follicle and sebaceous gland (B). Intestinal expression was primarily found in epithelial cells as illustrated in jejunum (C) and colon (D). In reproductive tissues, positive staining was found in epithelial Sertoli cells (E), testosterone producing Leydig cells (illustrated with white arrows) of the testis (F), and epithelial cells of the prostate gland G). H–K, In mammary tissue (H), endometrium of uterus (I), and endometrium of salpinx (K), the epithelial cell layer was staining strongly for α-Klotho protein; insets are larger magnifications of the epithelial layer. n ≥ 5 for each tissue.
Figure 4.
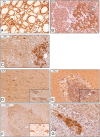
α-Klotho protein expression and distribution in human endocrine and neuronal tissues: IHC, positive staining (brown) was found in principal cells of the thyroid epithelium (A), islet cells of the pancreas (B), and catecholamine-producing medullary cells of the adrenal gland (C). When brain and spinal cord were stained, primarily neuronal cells were found to express α-Klotho protein, such as in the cerebral cortex (D), Purkinje cells between the molecular and granular layer in the cerebellum (E), motoneurons in the gray matter of the ventral horns of the spinal cord (F), and neuron cell bodies in the ganglia of the myenteric plexus of the intestine (G). Insets are larger magnifications of neuronal cell bodies. n ≥ 5 for each tissue.
Figure 5.
Mass spectrometry characterization of the transmembrane α-Klotho protein in human tissues and cells: extracellular α-Klotho peptide GLFYVDFLSQKD (exon 3). A–D, Representative mass spectrometry spectra (left) and Skyline data (right) confirmed the presence of full-length α-Klotho rh full-length α-Klotho protein (rh-α-Klotho) (A), renal proximal tubular epithelial cells (B), kidney tissue (C), and renal artery (D). E–G, The full-length specific (isoform 1) αKlotho peptide LWITMNEPYTR (exon 4). Representative mass spectrometry spectra (left) and Skyline data (right) confirmed the presence of full-length α-Klotho. E), rh full-length α-Klotho protein (rh-α-Klotho); F, kidney tissue; G, renal artery; and H, neuronal cells.
Similar articles
- Membrane-bound Klotho is not expressed endogenously in healthy or uraemic human vascular tissue.
Mencke R, Harms G, Mirković K, Struik J, Van Ark J, Van Loon E, Verkaik M, De Borst MH, Zeebregts CJ, Hoenderop JG, Vervloet MG, Hillebrands JL; NIGRAM Consortium. Mencke R, et al. Cardiovasc Res. 2015 Nov 1;108(2):220-31. doi: 10.1093/cvr/cvv187. Epub 2015 Jun 26. Cardiovasc Res. 2015. PMID: 26116633 - Involvement of Klotho, TNF‑α and ADAMs in radiation‑induced senescence of renal epithelial cells.
Kim DY, Lee M, Kim EJ. Kim DY, et al. Mol Med Rep. 2021 Jan;23(1):22. doi: 10.3892/mmr.2020.11660. Epub 2020 Nov 12. Mol Med Rep. 2021. PMID: 33179086 Free PMC article. - PAI-1 induction during kidney injury promotes fibrotic epithelial dysfunction via deregulation of klotho, p53, and TGF-β1-receptor signaling.
Gifford CC, Lian F, Tang J, Costello A, Goldschmeding R, Samarakoon R, Higgins PJ. Gifford CC, et al. FASEB J. 2021 Jul;35(7):e21725. doi: 10.1096/fj.202002652RR. FASEB J. 2021. PMID: 34110636 Free PMC article. - Correlation between Soluble _α_-Klotho and Renal Function in Patients with Chronic Kidney Disease: A Review and Meta-Analysis.
Wang Q, Su W, Shen Z, Wang R. Wang Q, et al. Biomed Res Int. 2018 Aug 12;2018:9481475. doi: 10.1155/2018/9481475. eCollection 2018. Biomed Res Int. 2018. PMID: 30159331 Free PMC article. Review. - Update on FGF23 and Klotho signaling.
Erben RG. Erben RG. Mol Cell Endocrinol. 2016 Sep 5;432:56-65. doi: 10.1016/j.mce.2016.05.008. Epub 2016 May 10. Mol Cell Endocrinol. 2016. PMID: 27178987 Review.
Cited by
- Potential application of Klotho as a prognostic biomarker for patients with diabetic kidney disease: a meta-analysis of clinical studies.
Yu LX, Sha MY, Chen Y, Tan F, Liu X, Li S, Liu QF. Yu LX, et al. Ther Adv Chronic Dis. 2023 Dec 4;14:20406223231213246. doi: 10.1177/20406223231213246. eCollection 2023. Ther Adv Chronic Dis. 2023. PMID: 38058396 Free PMC article. - Partial Genetic Deletion of Klotho Aggravates Cardiac Calcium Mishandling in Acute Kidney Injury.
González-Lafuente L, Navarro-García JA, Valero-Almazán Á, Rodríguez-Sánchez E, Vázquez-Sánchez S, Mercado-García E, Pineros P, Poveda J, Fernández-Velasco M, Kuro-O M, Ruilope LM, Ruiz-Hurtado G. González-Lafuente L, et al. Int J Mol Sci. 2023 Jan 10;24(2):1322. doi: 10.3390/ijms24021322. Int J Mol Sci. 2023. PMID: 36674838 Free PMC article. - The relationship between klotho, testosterone, and sexual health parameters among US adult men.
Glover F, Sullivan E, Mulloy E, Belladelli F, Del Giudice F, Eisenberg ML. Glover F, et al. J Endocrinol Invest. 2024 Mar;47(3):523-533. doi: 10.1007/s40618-023-02163-8. Epub 2023 Aug 30. J Endocrinol Invest. 2024. PMID: 37648906 - Klotho at the Edge of Alzheimer's Disease and Senile Depression.
Paroni G, Panza F, De Cosmo S, Greco A, Seripa D, Mazzoccoli G. Paroni G, et al. Mol Neurobiol. 2019 Mar;56(3):1908-1920. doi: 10.1007/s12035-018-1200-z. Epub 2018 Jul 5. Mol Neurobiol. 2019. PMID: 29978424 Review. - Hypertension modifies the association between serum Klotho and chronic kidney disease in US adults with diabetes: a cross-sectional study of the NHANES 2007-2016.
Hong T, Lian Z, Zhang C, Zhang W, Ye Z. Hong T, et al. Ren Fail. 2025 Dec;47(1):2498089. doi: 10.1080/0886022X.2025.2498089. Epub 2025 May 5. Ren Fail. 2025. PMID: 40324899 Free PMC article.
References
- Kuro-o M, Matsumura Y, Aizawa H, et al. Mutation of the mouse klotho gene leads to a syndrome resembling ageing. Nature. 1997;390:45–51. - PubMed
- Kenyon CJ. The genetics of ageing. Nature. 2010;464:504–512. - PubMed
- Stenvinkel P, Larsson TE. Chronic kidney disease: a clinical model of premature aging. Am J Kidney Dis. 2013;62:339–351. - PubMed
- Di Bona D, Accardi G, Virruso C, Candore G, Caruso C. Association of Klotho polymorphisms with healthy aging: a systematic review and meta-analysis. Rejuvenation Res. 2014;17:212–216. - PubMed
Publication types
MeSH terms
Substances
LinkOut - more resources
Full Text Sources
Other Literature Sources
Molecular Biology Databases


