Assessing breast cancer cell lines as tumour models by comparison of mRNA expression profiles - PubMed (original) (raw)
Assessing breast cancer cell lines as tumour models by comparison of mRNA expression profiles
Krista Marie Vincent et al. Breast Cancer Res. 2015.
Abstract
Introduction: Breast cancer researchers use cell lines to model myriad phenomena ranging from DNA repair to cancer stem cell phenotypes. Though appropriate, and even requisite, for many studies, the suitability of cell lines as tumour models has come into question owing to possibilities of tissue culture artefacts and clonal selection. These issues are compounded by the inability of cancer cells grown in isolation to fully model the in situ tumour environment, which also contains a plethora of non-tumour cell types. It is thus important to understand similarities and differences between cancer cell lines and the tumours that they represent so that the optimal tumour models can be chosen to answer specific research questions.
Methods: In the present study, we compared the RNA-sequencing transcriptomes of a collection of breast cancer cell lines to transcriptomes obtained from hundreds of tumours using The Cancer Genome Atlas. Tumour purity was accounted for by analysis of stromal and immune scores using the ESTIMATE algorithm so that differences likely resulting from non-tumour cells could be accounted for.
Results: We found the transcriptional characteristics of breast cancer cell lines to mirror those of the tumours. We identified basal and luminal cell lines that are most transcriptionally similar to their respective breast tumours. Our comparison of expression profiles revealed pronounced differences between breast cancer cell lines and tumours, which could largely be attributed to the absence of stromal and immune components in cell culture. A focus on the Wnt pathway revealed the transcriptional downregulation or absence of several secreted Wnt antagonists in culture. Gene set enrichment analysis suggests that cancer cell lines have enhanced proliferation and glycolysis independent of stromal and immune contributions compared with breast cancer cells in situ.
Conclusions: This study demonstrates that many of the differences between breast cancer cell lines and tumours are due to the absence of stromal and immune components in vitro. Hence, extra precautions should be taken when modelling extracellular proteins in vitro. The specific differences discovered emphasize the importance of choosing an appropriate model for each research question.
Figures
Fig. 1
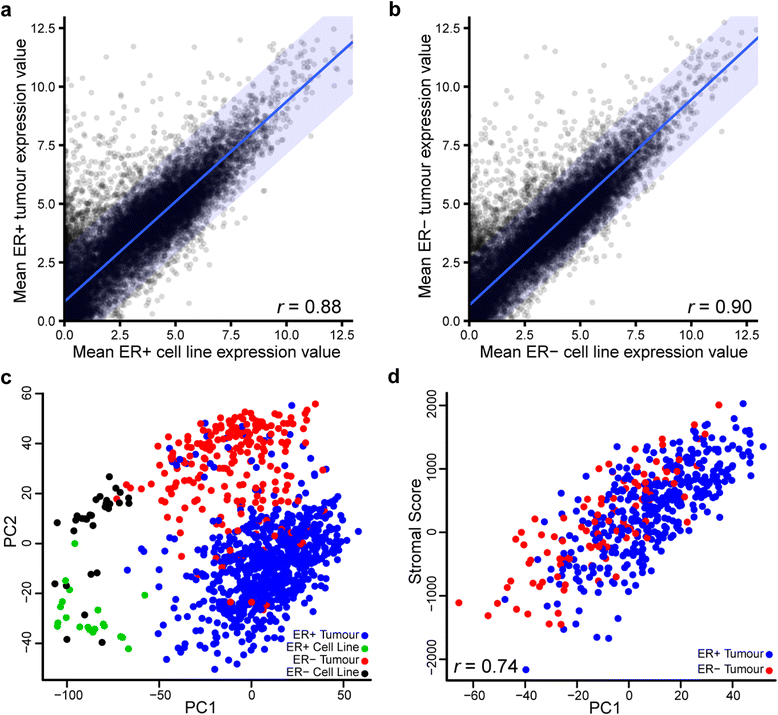
Transcriptional comparison of 50 breast cancer cell lines with 1025 breast cancer tumour samples in The Cancer Genome Atlas suggests overall transcriptional similarity. a, b Scatterplots of mean expression values (log2[transcripts per million + 1]) of 16,282 coding genes in cell lines (horizontal) and tumours (vertical) for oestrogen receptor–positive (ER+) (a) and oestrogen receptor–negative (ER−) (b) samples reveal that the two datasets are largely comparable with more outliers that are high in tumours and low in cell lines than vice versa. Blue lines indicate linear regression; blue shading indicates 95 % prediction interval for regression. c The 5000 most variable genes were used for principal component analysis, and the first two principal components (PC1 and PC2, respectively) explaining 28 % of the variance are displayed. Cell lines cluster apart from tumours on an axis largely explained by ER status. Colours of the points indicate sample types: ER+ tumour (blue), ER− tumour (red), ER+ cell line (green) and ER− cell line (black). d PC1 of the breast cancer tumours is highly correlated with ESTIMATE (Estimation of STromal and Immune cells in MAlignant Tumours using Expression data) paradigm stromal scores (r = 0.74)
Fig. 2
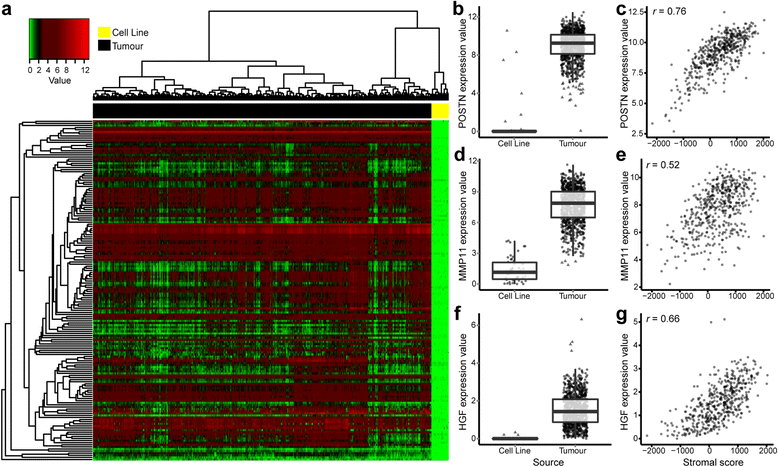
The top 1 % differentially expressed genes in the combined expression dataset. a Heatmap representation of the top 1 % of differentially expressed genes (adjusted p value by t test) in cell lines compared with tumours. In all cases, the direction of difference favoured high expression in tumour samples. All genes were investigated in tumours for potential correlation with the ESTIMATE (Estimation of STromal and Immune cells in MAlignant Tumours using Expression data) paradigm stromal and immune scores. Of the top 163 differentially expressed genes, 134 genes were found to have a Pearson’s correlation coefficient >0.5 (data not shown) with either stromal or immune score. Differential expression (box plot) and stromal correlations (scatterplot) are displayed for representative genes (b, c) POSTN, (d, e) MMP11 and (f, g) HGF. Box plots (b, d, f) show gene expression values (log2[transcripts per million {TPM} + 1)) stratified by sample source (cell line or tumour). Boxes represent interquartile ranges, and points represent individual sample values. Scatterplots (c, e, g) show gene expression values (log2(TPM+1)) versus stromal score (ESTIMATE algorithm) of tumours. Pearson’s correlation coefficient is displayed in the upper left corner
Fig. 3
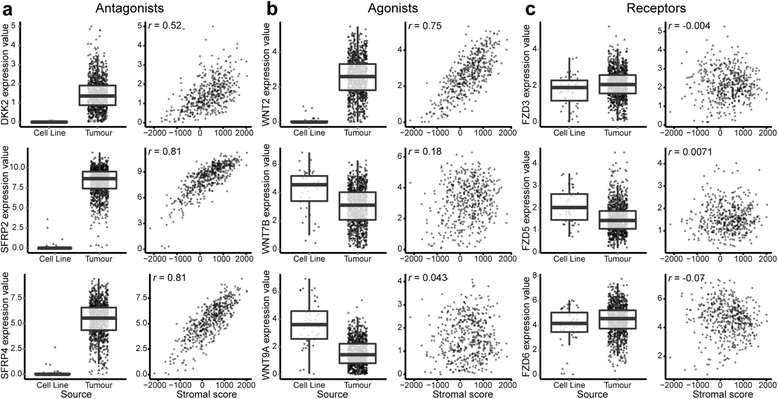
Of the Wnt pathway components, Wnt antagonists (and WNT2) are downregulated in cell culture compared with tumours and exhibit a strong correlation with stromal signatures. Differential expression (box plots) and stromal correlations (scatterplots) are displayed for representative (a) Wnt antagonists: DDK2, SFRP2 and SFRP4; (b) Wnt agonists: WNT2, WNT7B and WNT9A; and (c) Wnt receptors: FZD3, FZD5 and FZD6. Boxes represent interquartile ranges, and points represent individual sample values. Scatterplots (c, e and g) show gene expression values (log2[transcripts per million + 1]) versus stromal scores (ESTIMATE algorithm [Estimation of STromal and Immune cells in MAlignant Tumours using Expression data]) of tumours. Pearson’s correlation coefficient is displayed in the upper left corner
Fig. 4
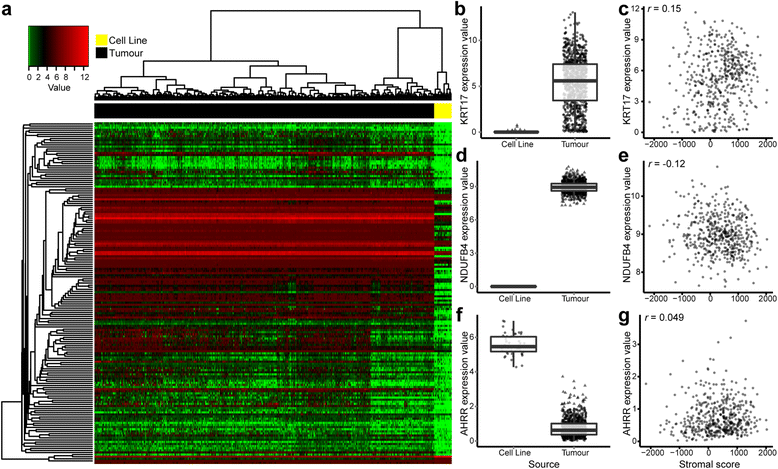
The top 1 % of differentially expressed genes after filtering out genes correlated with stromal and immune scores in tumours. a The list of differentially expressed genes was refined for correlation with stromal and immune signatures, uncovering novel differentially expressed genes more likely to genuinely reflect changes induced by cell culture. Heatmap representation of the filtered top 1 % of differentially expressed genes (|r| < 0.2; adjusted p value by t test) in cell lines compared with tumours. Differential expression (box plot) and stromal correlations (scatterplot) are displayed for representative genes: (b, c) KRT17, (d, e) NDUFB4 and (f, g) AHRR. b, d, f Boxplots show gene expression values (log2([transcripts per million {TPM}+1]) stratified by sample source (cell line or tumour). Boxes represent interquartile ranges, and points represent individual sample values. c, e, g Scatterplots show gene expression values (log2[TPM+1]) versus stromal scores (ESTIMATE algorithm [Estimation of STromal and Immune cells in MAlignant Tumours using Expression data]) of tumours. Pearson’s correlation coefficient is displayed in the upper left corner
Fig. 5
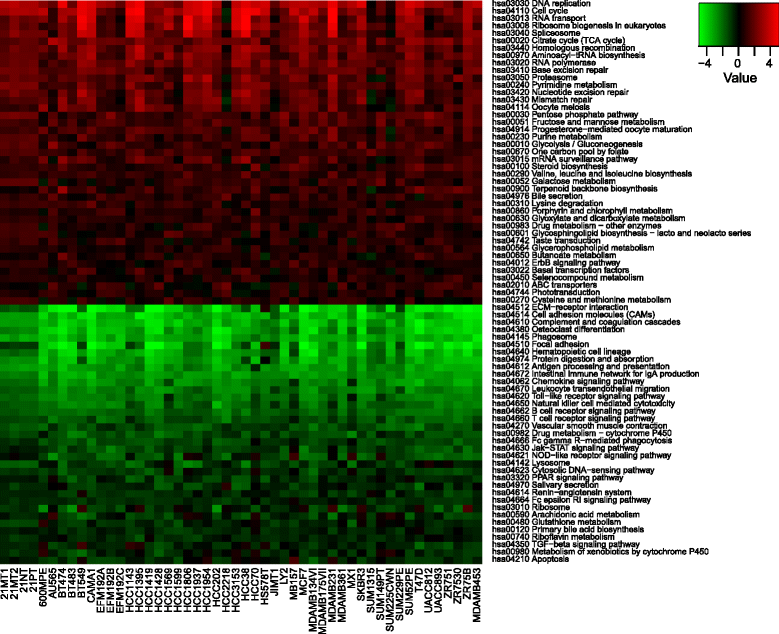
Gene set–specific differences between breast cancer cell lines and tumours. Unpaired Generally Applicable Gene-set Enrichment analysis reveals 41 upregulated and 35 downregulated pathways in breast cancer cell lines compared with tumours with a cutoff false discovery rate q value < 0.0001. Heatmap displays generally applicable gene set enrichment test statistics of the 50 cell lines investigated
Fig. 6
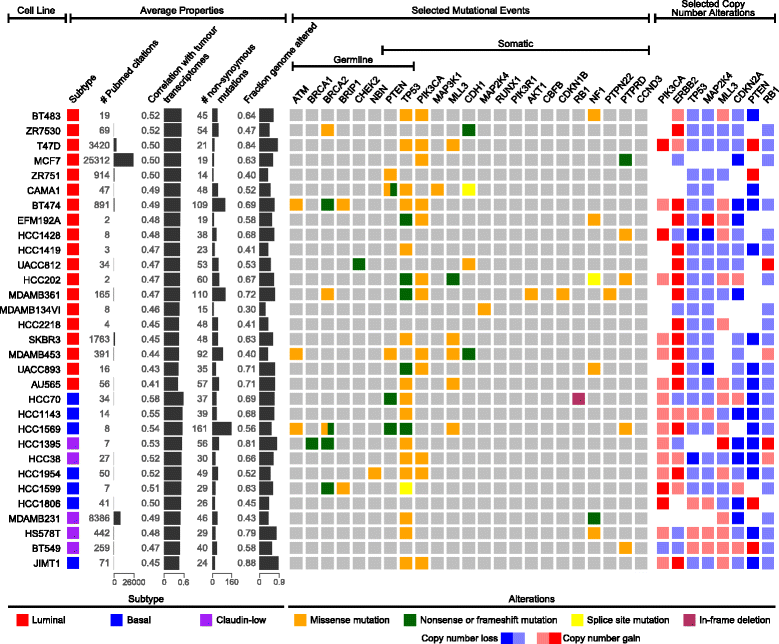
Genomic summary of breast cancer cells lines. Both average properties (left) and selected genetic events (right) specific to breast cancer can be used to distinguish when to use certain breast cancer cell lines. Average properties include the breast cancer subtype (luminal, basal or claudin-low), the citation frequency in the literature as an estimate of frequency of use, the average transcriptional correlation with tumours of the same subtype as determined in this study, the number of non-synonymous mutations in 1651 genes sequenced by hybrid capture, and the altered fraction of the genome. The selected genetic events include 8 possible germline mutations (ATM, BRCA1/2, BRIP1, CHEK2, NBN, PTEN and TP53), 17 possible somatic mutations (PTEN, TP53, PIK3CA, MAP3K1, MLL3, CDH1, MAP2K14, RUNX1, PIK3R1, AKT1, CBFB, CDKN1B, RB1, NF1, PTPN22, PTPRD and CCND3) and 8 possible copy number alterations (PIK3CA, ERBB2, TP53, MAP2K4, MLL3, CDKN2A, PTEN and RB1) determined to be significant in the original breast cancer study for The Cancer Genome Atlas and available on Cancer Cell Line Encyclopaedia platforms
Similar articles
- Investigating the utility of human melanoma cell lines as tumour models.
Vincent KM, Postovit LM. Vincent KM, et al. Oncotarget. 2017 Feb 7;8(6):10498-10509. doi: 10.18632/oncotarget.14443. Oncotarget. 2017. PMID: 28060736 Free PMC article. - Semaphorin-plexin signalling genes associated with human breast tumourigenesis.
Gabrovska PN, Smith RA, Tiang T, Weinstein SR, Haupt LM, Griffiths LR. Gabrovska PN, et al. Gene. 2011 Dec 10;489(2):63-9. doi: 10.1016/j.gene.2011.08.024. Epub 2011 Sep 2. Gene. 2011. PMID: 21925246 - Wnt signalling in human breast cancer: expression of the putative Wnt inhibitor Dickkopf-3 (DKK3) is frequently suppressed by promoter hypermethylation in mammary tumours.
Veeck J, Bektas N, Hartmann A, Kristiansen G, Heindrichs U, Knüchel R, Dahl E. Veeck J, et al. Breast Cancer Res. 2008;10(5):R82. doi: 10.1186/bcr2151. Epub 2008 Sep 30. Breast Cancer Res. 2008. PMID: 18826564 Free PMC article. - The cell of origin of BRCA1 mutation-associated breast cancer: a cautionary tale of gene expression profiling.
Molyneux G, Smalley MJ. Molyneux G, et al. J Mammary Gland Biol Neoplasia. 2011 Apr;16(1):51-5. doi: 10.1007/s10911-011-9202-8. Epub 2011 Feb 19. J Mammary Gland Biol Neoplasia. 2011. PMID: 21336547 Review. - An integrative hypothesis about the origin and development of sporadic and familial breast cancer subtypes.
Melchor L, Benítez J. Melchor L, et al. Carcinogenesis. 2008 Aug;29(8):1475-82. doi: 10.1093/carcin/bgn157. Epub 2008 Jul 1. Carcinogenesis. 2008. PMID: 18596026 Review.
Cited by
- The past, present, and future of breast cancer models for nanomedicine development.
Boix-Montesinos P, Soriano-Teruel PM, Armiñán A, Orzáez M, Vicent MJ. Boix-Montesinos P, et al. Adv Drug Deliv Rev. 2021 Jun;173:306-330. doi: 10.1016/j.addr.2021.03.018. Epub 2021 Mar 31. Adv Drug Deliv Rev. 2021. PMID: 33798642 Free PMC article. Review. - Transcriptomics indicate nuclear division and cell adhesion not recapitulated in MCF7 and MCF10A compared to luminal A breast tumours.
Goh JJH, Goh CJH, Lim QW, Zhang S, Koh CG, Chiam KH. Goh JJH, et al. Sci Rep. 2022 Dec 3;12(1):20902. doi: 10.1038/s41598-022-24511-z. Sci Rep. 2022. PMID: 36463288 Free PMC article. - Concise Polygenic Models for Cancer-Specific Identification of Drug-Sensitive Tumors from Their Multi-Omics Profiles.
Naulaerts S, Menden MP, Ballester PJ. Naulaerts S, et al. Biomolecules. 2020 Jun 26;10(6):963. doi: 10.3390/biom10060963. Biomolecules. 2020. PMID: 32604779 Free PMC article. - Regulator of calcineurin 3 as a novel predictor of diagnosis and prognosis in pan-cancer.
Liang Y, Diao W, Yang X, Tao Y, Hong L, Li W. Liang Y, et al. Croat Med J. 2024 Aug 31;65(4):356-372. doi: 10.3325/cmj.2024.65.356. Croat Med J. 2024. PMID: 39219199 Free PMC article. - Modeling chemical effects on breast cancer: the importance of the microenvironment in vitro.
Morgan MM, Schuler LA, Ciciliano JC, Johnson BP, Alarid ET, Beebe DJ. Morgan MM, et al. Integr Biol (Camb). 2020 Mar 6;12(2):21-33. doi: 10.1093/intbio/zyaa002. Integr Biol (Camb). 2020. PMID: 32118264 Free PMC article. Review.
References
- Lacroix M, Leclercq G. Relevance of breast cancer cell lines as models for breast tumours: an update. Breast Cancer Res Treat. 2004;83:249–89. doi: 10.1023/B:BREA.0000014042.54925.cc. - DOI - PubMed
- Lasfargues EY, Ozzello L. Cultivation of human breast carcinomas. J Natl Cancer Inst. 1958;21:1131–47. - PubMed
Publication types
MeSH terms
Substances
LinkOut - more resources
Full Text Sources
Other Literature Sources
Medical
