Metabolic Competition in the Tumor Microenvironment Is a Driver of Cancer Progression - PubMed (original) (raw)
. 2015 Sep 10;162(6):1229-41.
doi: 10.1016/j.cell.2015.08.016. Epub 2015 Aug 27.
Jing Qiu 1, David O'Sullivan 1, Michael D Buck 1, Takuro Noguchi 1, Jonathan D Curtis 1, Qiongyu Chen 1, Mariel Gindin 1, Matthew M Gubin 1, Gerritje J W van der Windt 1, Elena Tonc 1, Robert D Schreiber 1, Edward J Pearce 1, Erika L Pearce 2
Affiliations
- PMID: 26321679
- PMCID: PMC4864363
- DOI: 10.1016/j.cell.2015.08.016
Metabolic Competition in the Tumor Microenvironment Is a Driver of Cancer Progression
Chih-Hao Chang et al. Cell. 2015.
Abstract
Failure of T cells to protect against cancer is thought to result from lack of antigen recognition, chronic activation, and/or suppression by other cells. Using a mouse sarcoma model, we show that glucose consumption by tumors metabolically restricts T cells, leading to their dampened mTOR activity, glycolytic capacity, and IFN-γ production, thereby allowing tumor progression. We show that enhancing glycolysis in an antigenic "regressor" tumor is sufficient to override the protective ability of T cells to control tumor growth. We also show that checkpoint blockade antibodies against CTLA-4, PD-1, and PD-L1, which are used clinically, restore glucose in tumor microenvironment, permitting T cell glycolysis and IFN-γ production. Furthermore, we found that blocking PD-L1 directly on tumors dampens glycolysis by inhibiting mTOR activity and decreasing expression of glycolysis enzymes, reflecting a role for PD-L1 in tumor glucose utilization. Our results establish that tumor-imposed metabolic restrictions can mediate T cell hyporesponsiveness during cancer.
Copyright © 2015 Elsevier Inc. All rights reserved.
Figures
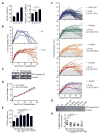
Figure 1. Tumor mediated glucose restriction alters T cell metabolism and dampens their ability to produce cytokine
(A) 1×10⁶ d42m1 derived R or P tumor cells were injected s.c. into 129S6 mice (n=5). Tumor size is shown as average of two perpendicular diameters ± SEM from 10 mice of 2 independent experiments. (B) C3 T cells were cultured alone, or with 1:5 P or R cells for 24h, then PMA/ionomycin stimulated ± 20 mM additional glucose (Glc) for 5h and IFN-γ measured by FACS. % of IFN-γ+ T cells (top right) and mean fluorescence intensity (MFI) (vertical); representative of ≥ 2 independent experiments. (C) Glucose concentrations in cultures (B) before stimulation; represent ≥2 independent experiments, shown as mean ± SEM, **_p_=0.0087, ***_p_=0.0011. (D) ECAR and R or P tumor proliferation. CellTrace Violet (CTV) labeled cells were measured for proliferation at day 0 and 3, representative of ≥3 independent experiments, ***_p_=0.001. (E) R or P tumors were injected s.c. into 129S6 mice and TILs isolated ~day 12. (F) CD44, CD62L, PD-1, T-bet, phosphorylated 4E-BP1 (p4E-BP1) and S6K (pS6K) expression in TILs by FACS, representative of ≥3 independent experiments. (G) ECAR and OCR/ECAR of ex vivo tumor cells and TILs. OCR (O2 consumption rate) is an indicator of OXPHOS. Data shown as mean ± SEM from 3 independent experiments. **_p_=0.003, ***_p_=0.001. (H) Maximum glycolytic capacity of TILs. Bar graph shown as mean ± SEM, representative of 2 independent experiments. (I) IFN-γ production in TILs measured 5h after PMA/ionomycin stimulation. Contour plots (above) and MFI of IFN-γ producing cells (below). Representative of ≥3 independent experiments. (J) Glucose concentration in extracellular milieu of tumors, ***_p_=0.0005. Data averaged from 5 mice. (K) 2-NBDG was injected i.v. into tumor-bearing mice and tumors harvested 15 min later. Histogram (above) depicts TIL 2-NBDG uptake. Bar chart (below) shows mean MFI ± SEM from 3 mice. **_p_=0.0147. See also Figure S1.
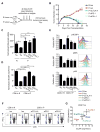
Figure 2. In vivo competition for glucose modulates mTOR activity and cytokine production in antigen-specific T cells
(A) 1×10⁶ or 40×106 EL4-Ova cells were injected i.p. into C57BL/6 mice that received 2×10⁴ naïve OT-I Thy1.1+ T cells i.v. Cells in the peritoneal cavity were assessed at day 7. (B) Phosphorylated 4E-BP1 (p4E-BP1), S6K (pS6K), and S6 (pS6) of OT-I T cells assessed by FACS and relative MFI from mice transplanted with 1×10⁶ EL4-Ova cells (1) or 40×106 EL4-Ova cells (40) normalized to MFI of T cells from mice injected with 1×10⁶ EL4-Ova cells. Bar graphs shown as mean ± SEM from 4 independent experiments. **_p_=0.0085, ***_p_=0.001. (C) IFN-γ production by donor OT-I T cells and CD8+ and CD4+ host T cells 5h post-PMA/ionomycin restimulation; % of IFN-γ+ T cells (top left) and MFI of IFN-γ+ cells (vertical), representative of 2 independent experiments. (D) Donor OT-I T cell in vivo IFN-γ production. Mice were injected i.p. with EL4-Ova cells and congenic naïve OT-I T cells i.v. Mice were injected 7 days later i.p. with BFA and PBS or glucose, and again 2.5h later. Cells were harvested 5h after the first injection and analyzed by FACS. Dot plots show MFI of IFN-γ+ cells relative to mice treated with PBS. Dots represent individual mice; horizontal bars indicate mean ± SEM from 2 independent experiments. _*p_=0.0142.
Figure 3. Enhancing glycolytic metabolism in antigenic tumors that are normally rejected promotes tumor progression
(A) R tumors were cultured in complete media (11 mM glucose and 10% FCS: R) or in high glucose/low FCS media (50 mM and 1% FCS: R-1%) >3 weeks and ECAR measured (left). 2-NBDG uptake in tumor cells measured by FACS (right). Data are average of 3 independent experiments, with R and P group values also used in Figure 5B. 2-NBDG MFI is normalized to R tumor MFI. ECAR data representative of 3 independent experiments, ***_p_=0.001. (B) 129S6 mice were injected s.c. with 1×10⁶ R or R-1% tumor cells. Tumor size shown as average of two perpendicular diameters ± SEM. (C) Ex vivo R-1% ‘progressed’ tumors and cultured R and P tumor cell spectrin-β2 expression. Data presented from 3 individual ex vivo R-1% tumors. (D) 1×10⁶ R or R-1% tumor cells were injected s.c. into Rag−/− 129S6 mice and tumor growth monitored. Data (B and D) from 2 independent experiments. (E) R tumor cells (R-No Tdx) were transduced with empty retroviral vector (R-EV Ctrl) or vectors expressing c-Myc (R-cMyc), PDK1 (R-PDK1), Glut1 (R-Glut1), or HK2 (R-HK2) and ECAR measured; represent ≥4 independent experiments. **_p_=0.0012 for R-EV Ctrl vs. R-cMyc, _p_=0.0091 for R-EV Ctrl vs. R-PDK1, _p_=0.0026 for R-EV Ctrl vs. R-Glut1, and _p_=0.0196 for R-EV Ctrl vs. R-HK2; ***_p_=0.001 for R-No Tdx vs. R-EV Ctrl. (F) 2×10⁶ transduced R tumor cells were injected s.c. into 129S6 mice and tumor growth monitored for 21 days, represent ≥3 independent experiments. (G) Spectrin-β2 expression from transduced tumors. (H) Mice bearing transduced tumors were injected i.v. with 2-NBDG on day 12 and acquisition by TILs and tumor cells measured by FACS. Data shown as MFI ratios of TILs-to-tumors normalized to R-EV Ctrl. Dots represent individual mice; horizontal bars indicate means ± SEM of 3 independent experiments. **_p_=0.009 for R-EV Ctrl vs R-cMyc, _p_=0.0065 for R-EV Ctrl vs R-Glut1, and _p_=0.0066 for R-EV Ctrl vs R-HK2. See also Figure S2.
Figure 4. T cells in progressing tumors regain glycolytic capacity and effector function after checkpoint blockade therapy
(A) 129S6 mice (n=6-8) were injected s.c. with R or P tumor cells and treated with anti-CTLA-4 (αCTLA-4), anti-PD-1 (αPD-1), anti-PD-L1 (αPD-L1), or isotype control (Iso) antibody at days 3, 6 and 9 after tumor inoculation. (B) Tumor size shown as average of two perpendicular diameters ± SEM of ≥3 independent experiments. (C–E) Glucose concentrations in the extracellular milieu of tumors measured at day 12 (C). Data normalized to R-Iso tumors and depict mean ± SEM from 1–3 independent experiments. *_p_=0.0208, **_p_=0.0015 (R vs. P-Iso), **_p_=0.0024, ***_p_=0.001. (D) TIL ECAR after checkpoint blockade. Data normalized to R-Iso tumors and depict mean ± SEM from 3 independent experiments. ***p<0.001. (E) Phosphorylation of 4E-BP1, S6 and S6K in TILs measured by FACS. Bar graphs (left) shown as mean ± SEM from 4 independent experiments and histograms (right) representative of 4 independent experiments. p4E-BP1: *_p_=0.0249, **_p_=0.0047 (αCTLA-4), **_p_=0.0050 (αPD-1). pS6K: **_p_=0.0024 (αCTLA-4), **_p_=0.0025 (αPD-L1). pS6: *_p_=0.0145 (αCTLA-4), *_p_=0.015 (αPD-1), *_p_=0.0134 (αPD-L1). (F) IFN-γ production of TILs 5h after PMA/ionomycin restimulation. % of IFN-γ+ cells (top left) and MFI of IFN-γ+ cells (vertical); representative of 3 independent experiments. (G) OCR vs. ECAR (mean ± SEM for both) of TILs after checkpoint blockade. Data from 3 independent experiments. See also Figure S3.
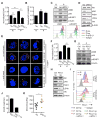
Figure 5. PD-L1 promotes mTOR activity and glycolytic metabolism in tumor cells
R or P tumor cells pre-treated with IFN-γ, followed by PD-L1 blockade (αPD-L1) or isotype control (Iso) antibodies. (A) ECAR post-treatment. Data from ≥5 independent experiments shown as relative ECAR normalized to R-Iso tumors. ***_p_=0.0001. (B) 2-NBDG uptake by tumor cells measured by FACS. Data from 3 independent experiments normalized to R tumor MFI values. ***_p_=0.001. (C) p4E-BP1, pS6K and pS6 analyzed by western blot; representative of 3 independent experiments; representative histograms of p4E-BP1 and pS6K assessed by FACS. (D) Akt, phosphorylated Akt (pAkt) and glycolytic enzymes PGK1, TPI, and LDHa examined by western blot; representative of 3 independent experiments. (E) R tumor clones expressing high levels of PD-L1 were treated with anti-PD-L1 antibody (αPD-L1) for 15 min on ice, then kept on ice (0 min) or incubated at 37°C for 30 min (30 min) and washed in acidic solution to dissociate antibody from the cell surface (+ acid wash) or left untreated (no acid wash). After fixation, cells were incubated with anti-Rat IgG A488 (red) to detect αPD-L1 on the cell surface. After permeabilization, cells were incubated with anti-Rat IgG A647 (yellow) to detect surface expressed and internalized αPD-L1 and nuclear stained (blue). Cells imaged by confocal microscopy. Data representative of 4 independent experiments. (F) ECAR of tumor cells transduced with pdl1 shRNA (PD-L1 hp) or control hp against luciferase (Ctrl hp). From 2 independent experiments represented as relative ECAR normalized to R Ctrl hp cells, ***p<0.0001. (G) p4E-BP1, pS6, and pS6K examined by western blot; representative of 3 independent experiments. (H) Western blot of Akt, pAkt, PGK1, LDHa, and TPI; representative of 3 independent experiments. (I) PD-L1 expression on IFN-γ pre-treated R or P tumor cells (top) or on PD-L1 hp or Ctrl hp transduced tumor cells treated with anti-PD-L1 (bottom). (J) ECAR of R tumors expressing high (Hi) and low (Lo) levels of surface PD-L1 after transduction with PD-L1 expressing retrovirus, represented as mean ± SEM of 2 independent experiments. (K) Rag−/− mice were injected s.c. with 2×10⁶ R-PD-L1 expressing tumor cells, followed by treatment with PD-L1 antibodies (αPD-L1) at days 2, 5, 8 and 11 after transplantation. Extracellular glucose was measured at day 12. Dots represent individual mice; horizontal bars indicate means ± SEM from 2 independent experiments. *_p_=0.0319. Figures 5D, H, and Figures S4D, G contain separate blots from equally loaded lanes due to similar sizes of glycolysis enzymes that necessitated separate probing. See also Figure S4.
Comment in
- Nutrient Competition: A New Axis of Tumor Immunosuppression.
Sukumar M, Roychoudhuri R, Restifo NP. Sukumar M, et al. Cell. 2015 Sep 10;162(6):1206-8. doi: 10.1016/j.cell.2015.08.064. Cell. 2015. PMID: 26359979 Free PMC article.
Similar articles
- Targeting CD73 enhances the antitumor activity of anti-PD-1 and anti-CTLA-4 mAbs.
Allard B, Pommey S, Smyth MJ, Stagg J. Allard B, et al. Clin Cancer Res. 2013 Oct 15;19(20):5626-35. doi: 10.1158/1078-0432.CCR-13-0545. Epub 2013 Aug 27. Clin Cancer Res. 2013. PMID: 23983257 - IFN-γ from lymphocytes induces PD-L1 expression and promotes progression of ovarian cancer.
Abiko K, Matsumura N, Hamanishi J, Horikawa N, Murakami R, Yamaguchi K, Yoshioka Y, Baba T, Konishi I, Mandai M. Abiko K, et al. Br J Cancer. 2015 Apr 28;112(9):1501-9. doi: 10.1038/bjc.2015.101. Epub 2015 Mar 31. Br J Cancer. 2015. PMID: 25867264 Free PMC article. - [Physiopathological mechanisms of immune-related adverse events induced by anti-CTLA-4, anti-PD-1 and anti-PD-L1 antibodies in cancer treatment].
Passat T, Touchefeu Y, Gervois N, Jarry A, Bossard C, Bennouna J. Passat T, et al. Bull Cancer. 2018 Nov;105(11):1033-1041. doi: 10.1016/j.bulcan.2018.07.005. Epub 2018 Sep 21. Bull Cancer. 2018. PMID: 30244981 Review. French. - Immunotherapy for the treatment of breast cancer: checkpoint blockade, cancer vaccines, and future directions in combination immunotherapy.
McArthur HL, Page DB. McArthur HL, et al. Clin Adv Hematol Oncol. 2016 Nov;14(11):922-933. Clin Adv Hematol Oncol. 2016. PMID: 27930644 Review. - CTLA-4 blockade expands infiltrating T cells and inhibits cancer cell repopulation during the intervals of chemotherapy in murine mesothelioma.
Wu L, Yun Z, Tagawa T, Rey-McIntyre K, de Perrot M. Wu L, et al. Mol Cancer Ther. 2012 Aug;11(8):1809-19. doi: 10.1158/1535-7163.MCT-11-1014. Epub 2012 May 14. Mol Cancer Ther. 2012. PMID: 22584123
Cited by
- Dysfunction of exhausted T cells is enforced by MCT11-mediated lactate metabolism.
Peralta RM, Xie B, Lontos K, Nieves-Rosado H, Spahr K, Joshi S, Ford BR, Quann K, Frisch AT, Dean V, Philbin M, Cillo AR, Gingras S, Poholek AC, Kane LP, Rivadeneira DB, Delgoffe GM. Peralta RM, et al. Nat Immunol. 2024 Nov 8. doi: 10.1038/s41590-024-01999-3. Online ahead of print. Nat Immunol. 2024. PMID: 39516648 - Development of a Competitive Nutrient-Based T-Cell Immunotherapy Designed to Block the Adaptive Warburg Effect in Acute Myeloid Leukemia.
Cao H, Xiao J, Baylink DJ, Nguyen V, Shim N, Lee J, Mallari DJR, Wasnik S, Mirshahidi S, Chen CS, Abdel-Azim H, Reeves ME, Xu Y. Cao H, et al. Biomedicines. 2024 Oct 3;12(10):2250. doi: 10.3390/biomedicines12102250. Biomedicines. 2024. PMID: 39457563 Free PMC article. - Insights into Metabolic Reprogramming in Tumor Evolution and Therapy.
Chiu CF, Guerrero JJG, Regalado RRH, Zamora MJB, Zhou J, Notarte KI, Lu YW, Encarnacion PC, Carles CDD, Octavo EM, Limbaroc DCI, Saengboonmee C, Huang SY. Chiu CF, et al. Cancers (Basel). 2024 Oct 17;16(20):3513. doi: 10.3390/cancers16203513. Cancers (Basel). 2024. PMID: 39456607 Free PMC article. Review. - Convergent inducers and effectors of T cell paralysis in the tumour microenvironment.
Hanahan D, Michielin O, Pittet MJ. Hanahan D, et al. Nat Rev Cancer. 2024 Oct 24. doi: 10.1038/s41568-024-00761-z. Online ahead of print. Nat Rev Cancer. 2024. PMID: 39448877 Review. - Optimizing CD8+ T cell-based immunotherapy via metabolic interventions: a comprehensive review of intrinsic and extrinsic modulators.
Zhou Z, Zheng J, Lu Y, Mai Z, Lin Y, Lin P, Zheng Y, Chen X, Xu R, Zhao X, Cui L. Zhou Z, et al. Exp Hematol Oncol. 2024 Oct 22;13(1):103. doi: 10.1186/s40164-024-00575-7. Exp Hematol Oncol. 2024. PMID: 39438986 Free PMC article. Review.
References
- Anichini A, Molla A, Vegetti C, Bersani I, Zappasodi R, Arienti F, Ravagnani F, Maurichi A, Patuzzo R, Santinami M, et al. Tumor-reactive CD8+ early effector T cells identified at tumor site in primary and metastatic melanoma. Cancer research. 2010;70:8378–8387. - PubMed
Publication types
MeSH terms
Substances
Grants and funding
- R56 AI032573/AI/NIAID NIH HHS/United States
- U01 CA141541/CA/NCI NIH HHS/United States
- R37 CA043059/CA/NCI NIH HHS/United States
- CA164062/CA/NCI NIH HHS/United States
- R01 AI032573/AI/NIAID NIH HHS/United States
- R01 CA164062/CA/NCI NIH HHS/United States
- AI091965/AI/NIAID NIH HHS/United States
- CA43059/CA/NCI NIH HHS/United States
- CA181125/CA/NCI NIH HHS/United States
- R01 AI091965/AI/NIAID NIH HHS/United States
- AI032573/AI/NIAID NIH HHS/United States
- R01 CA043059/CA/NCI NIH HHS/United States
- CA141541/CA/NCI NIH HHS/United States
- R01 CA181125/CA/NCI NIH HHS/United States
LinkOut - more resources
Full Text Sources
Other Literature Sources
Research Materials
Miscellaneous


