Genetic Heritage of the Balto-Slavic Speaking Populations: A Synthesis of Autosomal, Mitochondrial and Y-Chromosomal Data - PubMed (original) (raw)
. 2015 Sep 2;10(9):e0135820.
doi: 10.1371/journal.pone.0135820. eCollection 2015.
Olga Utevska 2, Marina Chuhryaeva 3, Anastasia Agdzhoyan 3, Khadizhat Dibirova 3, Ingrida Uktveryte 4, Märt Möls 5, Lejla Mulahasanovic 6, Andrey Pshenichnov 7, Svetlana Frolova 7, Andrey Shanko 7, Ene Metspalu 8, Maere Reidla 8, Kristiina Tambets 9, Erika Tamm 8, Sergey Koshel 10, Valery Zaporozhchenko 3, Lubov Atramentova 11, Vaidutis Kučinskas 4, Oleg Davydenko 12, Olga Goncharova 13, Irina Evseeva 14, Michail Churnosov 15, Elvira Pocheshchova 16, Bayazit Yunusbayev 17, Elza Khusnutdinova 18, Damir Marjanović 19, Pavao Rudan 20, Siiri Rootsi 9, Nick Yankovsky 21, Phillip Endicott 22, Alexei Kassian 23, Anna Dybo 24; Genographic Consortium; Chris Tyler-Smith 25, Elena Balanovska 7, Mait Metspalu 9, Toomas Kivisild 26, Richard Villems 27, Oleg Balanovsky 3
Affiliations
- PMID: 26332464
- PMCID: PMC4558026
- DOI: 10.1371/journal.pone.0135820
Genetic Heritage of the Balto-Slavic Speaking Populations: A Synthesis of Autosomal, Mitochondrial and Y-Chromosomal Data
Alena Kushniarevich et al. PLoS One. 2015.
Abstract
The Slavic branch of the Balto-Slavic sub-family of Indo-European languages underwent rapid divergence as a result of the spatial expansion of its speakers from Central-East Europe, in early medieval times. This expansion-mainly to East Europe and the northern Balkans-resulted in the incorporation of genetic components from numerous autochthonous populations into the Slavic gene pools. Here, we characterize genetic variation in all extant ethnic groups speaking Balto-Slavic languages by analyzing mitochondrial DNA (n = 6,876), Y-chromosomes (n = 6,079) and genome-wide SNP profiles (n = 296), within the context of other European populations. We also reassess the phylogeny of Slavic languages within the Balto-Slavic branch of Indo-European. We find that genetic distances among Balto-Slavic populations, based on autosomal and Y-chromosomal loci, show a high correlation (0.9) both with each other and with geography, but a slightly lower correlation (0.7) with mitochondrial DNA and linguistic affiliation. The data suggest that genetic diversity of the present-day Slavs was predominantly shaped in situ, and we detect two different substrata: 'central-east European' for West and East Slavs, and 'south-east European' for South Slavs. A pattern of distribution of segments identical by descent between groups of East-West and South Slavs suggests shared ancestry or a modest gene flow between those two groups, which might derive from the historic spread of Slavic people.
Conflict of interest statement
Competing Interests: The authors' have read the journal's policy and the authors of this manuscript have the following competing interests: Co-author Toomas Kivisild is a PLOS ONE Academic Editor. Additionally, Lejla Mulahasanovic is employed by Center for Genomics and Transcriptomics (CeGaT GmbH). There are no patents, products in development or marketed products to declare. This does not alter the authors' adherence to all the PLOS ONE policies on sharing data and materials.
Figures
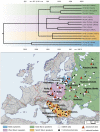
Fig 1. The Balto-Slavic populations analyzed in this study and the tree of Balto-Slavic languages.
The map (lower panel) shows the geographical distribution of Balto-Slavic populations (colored areas) within Europe. The symbols on the map represent the geographic location of the populations genotyped. The map was created in the GeneGeo software as described previously [68,75]. A manually constructed consensus phylogenetic tree of the Balto-Slavic languages (upper panel) is based on the StarlingNJ, NJ, BioNJ, UPGMA, Bayesian MCMC, Unweighted Maximum Parsimony methods. Ternary nodes resulting from neighboring binary nodes were joined together if the temporal distance between them was ≤ 300 years. StarlingNJ dates are proposed (S2 File).
Fig 2. Genetic structure of the Balto-Slavic populations within a European context according to the three genetic systems.
a) PC1vsPC3 plot based on autosomal SNPs (PC1 = 0.53; PC3 = 0.26); b) MDS based on NRY data (stress = 0.13); c) MDS based on mtDNA data (stress = 0.20). We focus on PC1_vs_PC3 because PC2 (S1 Fig) whilst differentiating the Volga region populations from the rest of Europeans had a low efficiency in detecting differences among the Balto-Slavic populations–the primary focus of this work.
Fig 3. ADMIXTURE plot (k = 6).
Ancestry proportions of 1,194 individuals as revealed by ADMIXTURE.
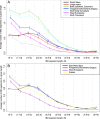
Fig 4. Distribution of the average number of IBD segments between groups of East-West Slavs (a), South Slavs (b), and their respective geographic neighbors.
The x-axis indicates ten classes of IBD segment length (in cM); the y-axis indicates the average number of shared IBD segments per pair of individuals within each length class.
Fig 5. Correlations between matrices of genetic, geographic and linguistic distances among Balto-Slavic populations.
Similar articles
- Contemporary paternal genetic landscape of Polish and German populations: from early medieval Slavic expansion to post-World War II resettlements.
Rębała K, Martínez-Cruz B, Tönjes A, Kovacs P, Stumvoll M, Lindner I, Büttner A, Wichmann HE, Siváková D, Soták M, Quintana-Murci L, Szczerkowska Z, Comas D; Genographic Consortium. Rębała K, et al. Eur J Hum Genet. 2013 Apr;21(4):415-22. doi: 10.1038/ejhg.2012.190. Epub 2012 Sep 12. Eur J Hum Genet. 2013. PMID: 22968131 Free PMC article. - Y-STR variation among Slavs: evidence for the Slavic homeland in the middle Dnieper basin.
Rębała K, Mikulich AI, Tsybovsky IS, Siváková D, Džupinková Z, Szczerkowska-Dobosz A, Szczerkowska Z. Rębała K, et al. J Hum Genet. 2007;52(5):406-414. doi: 10.1007/s10038-007-0125-6. Epub 2007 Mar 16. J Hum Genet. 2007. PMID: 17364156 - Uniparental genetic heritage of belarusians: encounter of rare middle eastern matrilineages with a central European mitochondrial DNA pool.
Kushniarevich A, Sivitskaya L, Danilenko N, Novogrodskii T, Tsybovsky I, Kiseleva A, Kotova S, Chaubey G, Metspalu E, Sahakyan H, Bahmanimehr A, Reidla M, Rootsi S, Parik J, Reisberg T, Achilli A, Hooshiar Kashani B, Gandini F, Olivieri A, Behar DM, Torroni A, Davydenko O, Villems R. Kushniarevich A, et al. PLoS One. 2013 Jun 13;8(6):e66499. doi: 10.1371/journal.pone.0066499. Print 2013. PLoS One. 2013. PMID: 23785503 Free PMC article. - Review of Croatian genetic heritage as revealed by mitochondrial DNA and Y chromosomal lineages.
Pericić M, Barać Lauc L, Martinović Klarić I, Janićijević B, Rudan P. Pericić M, et al. Croat Med J. 2005 Aug;46(4):502-13. Croat Med J. 2005. PMID: 16100752 Review. - Genetic Structure of the Armenian Population.
Yepiskoposyan L, Hovhannisyan A, Khachatryan Z. Yepiskoposyan L, et al. Arch Immunol Ther Exp (Warsz). 2016 Dec;64(Suppl 1):113-116. doi: 10.1007/s00005-016-0431-9. Epub 2017 Jan 12. Arch Immunol Ther Exp (Warsz). 2016. PMID: 28083603 Review.
Cited by
- Ancient human mitochondrial genomes from Bronze Age Bulgaria: new insights into the genetic history of Thracians.
Modi A, Nesheva D, Sarno S, Vai S, Karachanak-Yankova S, Luiselli D, Pilli E, Lari M, Vergata C, Yordanov Y, Dimitrova D, Kalcev P, Staneva R, Antonova O, Hadjidekova S, Galabov A, Toncheva D, Caramelli D. Modi A, et al. Sci Rep. 2019 Apr 1;9(1):5412. doi: 10.1038/s41598-019-41945-0. Sci Rep. 2019. PMID: 30931994 Free PMC article. - Genetic Diversity Based on Human Y Chromosome Analysis: A Bibliometric Review Between 2014 and 2023.
Hodișan R, Zaha DC, Jurca CM, Petchesi CD, Bembea M. Hodișan R, et al. Cureus. 2024 Apr 18;16(4):e58542. doi: 10.7759/cureus.58542. eCollection 2024 Apr. Cureus. 2024. PMID: 38887511 Free PMC article. Review. - Variation of Genomic Sites Associated with Severe Covid-19 Across Populations: Global and National Patterns.
Balanovsky O, Petrushenko V, Mirzaev K, Abdullaev S, Gorin I, Chernevskiy D, Agdzhoyan A, Balanovska E, Kryukov A, Temirbulatov I, Sychev D. Balanovsky O, et al. Pharmgenomics Pers Med. 2021 Nov 4;14:1391-1402. doi: 10.2147/PGPM.S320609. eCollection 2021. Pharmgenomics Pers Med. 2021. PMID: 34764675 Free PMC article. - A Machine-Learning-Based Approach to Prediction of Biogeographic Ancestry within Europe.
Kloska A, Giełczyk A, Grzybowski T, Płoski R, Kloska SM, Marciniak T, Pałczyński K, Rogalla-Ładniak U, Malyarchuk BA, Derenko MV, Kovačević-Grujičić N, Stevanović M, Drakulić D, Davidović S, Spólnicka M, Zubańska M, Woźniak M. Kloska A, et al. Int J Mol Sci. 2023 Oct 11;24(20):15095. doi: 10.3390/ijms242015095. Int J Mol Sci. 2023. PMID: 37894775 Free PMC article. - Reconstructing recent population history while mapping rare variants using haplotypes.
Yunusbaev U, Valeev A, Yunusbaeva M, Kwon HW, Mägi R, Metspalu M, Yunusbayev B. Yunusbaev U, et al. Sci Rep. 2019 Apr 10;9(1):5849. doi: 10.1038/s41598-019-42385-6. Sci Rep. 2019. PMID: 30971755 Free PMC article.
References
- Fortson Benjamin W. IV. Indo-European Language and Culture: An Introduction. Oxford: Blackwell; 2004.
- Mallory JP, Adams DQ. The Oxford introduction to Proto-Indo-European and the Proto-Indo-European world. Oxford: Oxford University Press; 2006.
- Rexová K, Frynta D, Zrzavý J. Cladistic analysis of languages: Indo-European classification based on lexicostatistical data. Cladistics. 2003;19: 120–127. 10.1111/j.1096-0031.2003.tb00299.x - DOI
- Ringe D, Warnow T, Taylor A. Indo-European and Computational Cladistics. Trans Philol Soc. 2002;100: 59–129. 10.1111/1467-968X.00091 - DOI
- Nakhleh L, Warnow T, Ringe D, Evans SN. A comparison of phylogenetic reconstruction methods on an Indo-European dataset. Trans Philol Soc. 2005;103: 171–192. 10.1111/j.1467-968X.2005.00149.x - DOI
Publication types
MeSH terms
Substances
LinkOut - more resources
Full Text Sources
Other Literature Sources
Research Materials


