Comparative transcriptomics reveals key differences in the response to milk oligosaccharides of infant gut-associated bifidobacteria - PubMed (original) (raw)
Comparative transcriptomics reveals key differences in the response to milk oligosaccharides of infant gut-associated bifidobacteria
Daniel Garrido et al. Sci Rep. 2015.
Erratum in
- Erratum: Comparative transcriptomics reveals key differences in the response to milk oligosaccharides of infant gut-associated bifidobacteria.
Garrido D, Ruiz-Moyano S, Lemay DG, Sela DA, German JB, Mills DA. Garrido D, et al. Sci Rep. 2015 Nov 2;5:15311. doi: 10.1038/srep15311. Sci Rep. 2015. PMID: 26522826 Free PMC article. No abstract available.
Abstract
Breast milk enhances the predominance of Bifidobacterium species in the infant gut, probably due to its large concentration of human milk oligosaccharides (HMO). Here we screened infant-gut isolates of Bifidobacterium longum subsp. infantis and Bifidobacterium bifidum using individual HMO, and compared the global transcriptomes of representative isolates on major HMO by RNA-seq. While B. infantis displayed homogeneous HMO-utilization patterns, B. bifidum were more diverse and some strains did not use fucosyllactose (FL) or sialyllactose (SL). Transcriptomes of B. bifidum SC555 and B. infantis ATCC 15697 showed that utilization of pooled HMO is similar to neutral HMO, while transcriptomes for growth on FL were more similar to lactose than HMO in B. bifidum. Genes linked to HMO-utilization were upregulated by neutral HMO and SL, but not by FL in both species. In contrast, FL induced the expression of alternative gene clusters in B. infantis. Results also suggest that B. bifidum SC555 does not utilize fucose or sialic acid from HMO. Surprisingly, expression of orthologous genes differed between both bifidobacteria even when grown on identical substrates. This study highlights two major strategies found in Bifidobacterium species to process HMO, and presents detailed information on the close relationship between HMO and infant-gut bifidobacteria.
Conflict of interest statement
Two of the authors (JBG, DAM) are the co-founders of Evolve Biosystems, a company focused on diet-based manipulation of the gut microbiota.
Figures
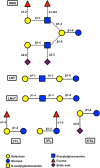
Figure 1. Representative structure of HMO and major oligosaccharides found in breast milk.
Dashed lines represent glycosidic linkages not found in all HMO.
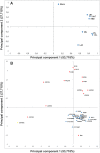
Figure 2. Principal component analysis (PCA) defined by the two principal components (PC1 and PC2) of the maximum OD600 values of B. infantis (blue) and B. bifidum (red) growth on HMO, LNT, LNnT, 2FL, 3FL, 6SL, mucin and lactose.
Negative control, B. animalis (Yellow). (A) represents variables (oligosaccharides substrates) and (B) bifidobacteria strains.
Figure 3. Whole transcriptome distances in substrate responses of B. infantis (A) and B. bifidum (B).
The heatmap shows the distances between the B. infantis whole transcriptomes in response to the substrate listed: SL6 = 6′siayllactose, FL3 = 3-fucosyllactose, FL2 = 2′fucosyllactose, HMOearly = HMO at early time point, HMOmid = HMO at mid time point, HMOlate = HMO at late time point, LNT = Lacto-_N-_tetraose, LNnT = Lacto-_N-_neotetraose, “(.A)” = first biological replicate, “(.B)” = second biological replicate. The distances calculated are Euclidian distances of the variance-stabilized count data. The darkness of the blue color in the heatmap indicates the degree of similarity, from white (dissimilar) to dark blue (most similar). Likewise, the dendograms also show the distances with larger branch lengths indicating greater distances.
Figure 4. Hierarchical clustering of features (HCF), of the whole transcriptome of B. infantis during growth on HMO and major HMO.
The heat map represents the expression of genes in Table S9.
Figure 5. Hierarchical clustering of features (HCF), of the whole transcriptome of B. bifidum during growth on HMO and major HMO.
The heat map represents the expression of genes in Table S10.
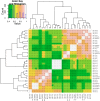
Figure 6. Map of correlations between orthologous transcriptomes in B. infantis and B. bifidum.
Each box in the heatmap represents the correlation between the transcriptomes indicated on the x-axis and y-axis: BLON = B. infantis, BBIF = B. bifidum, SL6 = 6′siayllactose, FL3 = 3′fucosyllactose, FL2 = 2′fucosyllactose, HMOearly = HMO at early time point, HMOmid = HMO at mid time point, HMOlate = HMO at late time point, LNT = Lacto-_N-_tetraose, LNnT = Lacto-_N-_neotetraose “(.A)” = first biological replicate, “(.B)” = second biological replicate. The color key indicates the correlation also indicated by the text in each box: The color key also includes a light blue line that indicates the number of observations at each level of expression.
Similar articles
- Fucosyllactose and L-fucose utilization of infant Bifidobacterium longum and Bifidobacterium kashiwanohense.
Bunesova V, Lacroix C, Schwab C. Bunesova V, et al. BMC Microbiol. 2016 Oct 26;16(1):248. doi: 10.1186/s12866-016-0867-4. BMC Microbiol. 2016. PMID: 27782805 Free PMC article. - A novel gene cluster allows preferential utilization of fucosylated milk oligosaccharides in Bifidobacterium longum subsp. longum SC596.
Garrido D, Ruiz-Moyano S, Kirmiz N, Davis JC, Totten SM, Lemay DG, Ugalde JA, German JB, Lebrilla CB, Mills DA. Garrido D, et al. Sci Rep. 2016 Oct 19;6:35045. doi: 10.1038/srep35045. Sci Rep. 2016. PMID: 27756904 Free PMC article. - Physiology of consumption of human milk oligosaccharides by infant gut-associated bifidobacteria.
Asakuma S, Hatakeyama E, Urashima T, Yoshida E, Katayama T, Yamamoto K, Kumagai H, Ashida H, Hirose J, Kitaoka M. Asakuma S, et al. J Biol Chem. 2011 Oct 7;286(40):34583-92. doi: 10.1074/jbc.M111.248138. Epub 2011 Aug 9. J Biol Chem. 2011. PMID: 21832085 Free PMC article. - Varied Pathways of Infant Gut-Associated Bifidobacterium to Assimilate Human Milk Oligosaccharides: Prevalence of the Gene Set and Its Correlation with Bifidobacteria-Rich Microbiota Formation.
Sakanaka M, Gotoh A, Yoshida K, Odamaki T, Koguchi H, Xiao JZ, Kitaoka M, Katayama T. Sakanaka M, et al. Nutrients. 2019 Dec 26;12(1):71. doi: 10.3390/nu12010071. Nutrients. 2019. PMID: 31888048 Free PMC article. Review. - Human milk oligosaccharides and infant gut bifidobacteria: Molecular strategies for their utilization.
Thomson P, Medina DA, Garrido D. Thomson P, et al. Food Microbiol. 2018 Oct;75:37-46. doi: 10.1016/j.fm.2017.09.001. Epub 2017 Sep 4. Food Microbiol. 2018. PMID: 30056961 Review.
Cited by
- Effect of a novel animal milk oligosaccharide biosimilar on the gut microbial communities and metabolites of in vitro incubations using feline and canine fecal inocula.
Oba PM, Vidal S, Wyss R, Miao Y, Adesokan Y, Swanson KS. Oba PM, et al. J Anim Sci. 2020 Sep 1;98(9):skaa273. doi: 10.1093/jas/skaa273. J Anim Sci. 2020. PMID: 32845316 Free PMC article. - Variation in the Conservation of Species-Specific Gene Sets for HMO Degradation and Its Effects on HMO Utilization in Bifidobacteria.
Hermes GDA, Rasmussen C, Wellejus A. Hermes GDA, et al. Nutrients. 2024 Jun 15;16(12):1893. doi: 10.3390/nu16121893. Nutrients. 2024. PMID: 38931248 Free PMC article. - Succession of Bifidobacterium longum Strains in Response to a Changing Early Life Nutritional Environment Reveals Dietary Substrate Adaptations.
Kujawska M, La Rosa SL, Roger LC, Pope PB, Hoyles L, McCartney AL, Hall LJ. Kujawska M, et al. iScience. 2020 Aug 21;23(8):101368. doi: 10.1016/j.isci.2020.101368. Epub 2020 Jul 15. iScience. 2020. PMID: 32721872 Free PMC article. - Comparative Genomics Analyses Reveal the Differences between B. longum subsp. infantis and B. longum subsp. longum in Carbohydrate Utilisation, CRISPR-Cas Systems and Bacteriocin Operons.
Li M, Zhou X, Stanton C, Ross RP, Zhao J, Zhang H, Yang B, Chen W. Li M, et al. Microorganisms. 2021 Aug 11;9(8):1713. doi: 10.3390/microorganisms9081713. Microorganisms. 2021. PMID: 34442792 Free PMC article. - An In Vitro Colonic Fermentation Study of the Effects of Human Milk Oligosaccharides on Gut Microbiota and Short-Chain Fatty Acid Production in Infants Aged 0-6 Months.
Li M, Lu H, Xue Y, Ning Y, Yuan Q, Li H, He Y, Jia X, Wang S. Li M, et al. Foods. 2024 Mar 18;13(6):921. doi: 10.3390/foods13060921. Foods. 2024. PMID: 38540911 Free PMC article.
References
- Newburg D. S., Ruiz-Palacios G. M. & Morrow A. L. Human milk glycans protect infants against enteric pathogens. Annu Rev Nutr 25, 37–58 (2005). - PubMed
- Petherick A. Development: Mother’s milk: A rich opportunity. Nature 468, S5–7 (2010). - PubMed
Publication types
MeSH terms
Substances
Grants and funding
- R01AT008759/AT/NCCIH NIH HHS/United States
- R01HD061923/HD/NICHD NIH HHS/United States
- R01 HD061923/HD/NICHD NIH HHS/United States
- R01 HD065122/HD/NICHD NIH HHS/United States
- R01HD065122/HD/NICHD NIH HHS/United States
- R01AT007079/AT/NCCIH NIH HHS/United States
- R01 AT008759/AT/NCCIH NIH HHS/United States
- R01 AT007079/AT/NCCIH NIH HHS/United States
LinkOut - more resources
Full Text Sources
Other Literature Sources
Research Materials


