Structure of mammalian eIF3 in the context of the 43S preinitiation complex - PubMed (original) (raw)
Structure of mammalian eIF3 in the context of the 43S preinitiation complex
Amedee des Georges et al. Nature. 2015.
Abstract
During eukaryotic translation initiation, 43S complexes, comprising a 40S ribosomal subunit, initiator transfer RNA and initiation factors (eIF) 2, 3, 1 and 1A, attach to the 5'-terminal region of messenger RNA and scan along it to the initiation codon. Scanning on structured mRNAs also requires the DExH-box protein DHX29. Mammalian eIF3 contains 13 subunits and participates in nearly all steps of translation initiation. Eight subunits having PCI (proteasome, COP9 signalosome, eIF3) or MPN (Mpr1, Pad1, amino-terminal) domains constitute the structural core of eIF3, to which five peripheral subunits are flexibly linked. Here we present a cryo-electron microscopy structure of eIF3 in the context of the DHX29-bound 43S complex, showing the PCI/MPN core at ∼6 Å resolution. It reveals the organization of the individual subunits and their interactions with components of the 43S complex. We were able to build near-complete polyalanine-level models of the eIF3 PCI/MPN core and of two peripheral subunits. The implications for understanding mRNA ribosomal attachment and scanning are discussed.
Figures
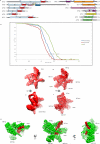
Extended Data Fig. 1. Domain organization of the eIF3 subunits and resolution of eIF3 core
a, Schematic representation of the domain organization of the rabbit eIF3 subunits (see Methods). Domain boundaries are indicated, and based where possible on our polyalanine-level model of eIF3. Z = Zinc-recognition motif, HD = helical domain. Dashed line in eIF3l subunit diagram indicates that the HD might extend further in the N-terminus but it was not possible to be conclusive based on our density map. b, Fourier shell correlation (FSC) of the different 43S complex reconstructions used during analysis. The resolution estimation followed the “gold standard” protocol ensuring independence of the half-set reconstructions. x-axis, resolution in Å; y-axis, FSC. 43S complexes including particles that present the eIF3 core subunits (green line). 43S complexes including all particles presenting DHX29 and the eIF3 peripheral subunits b, g and i (blue line). 43S complexes including all particles presenting the density attributed to eIF3d (red line). For each reconstruction, a dashed line marks the resolution at which the FSC reaches the value of 0.143. c to f, Qualitative comparison of eIF3 core resolution in the present and in previous structures. c and d, eIF3 core cryo-EM structure from our previous study at 11.6 Å (ref. 7). e and f, eIF3 core cryo-EM structure from the present study at 6 Å after focused refinement. eIF3 core is labeled according to the anthropomorphic nomenclature. g, Unassigned density region of the eIF3 core cryo-EM structure, colored in red, seen from three different orientations. The green surface represents most of the core region that was modeled.
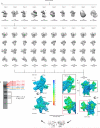
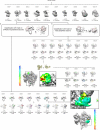
Extended Data Fig. 2. Sorting of particle images and focused refinement of the 5-lobed core of eIF3
a, Composition of eIF3 purified from RRL for assembly of 43S complexes, resolved by SDS-PAGE and analyzed by nanoLC-MS/MS to characterize truncation of eIF3a and eIF3c due to endoproteolytic cleavage. The intensity of labels in this panel reflects the intensity of bands corresponding to the truncated forms of eIF3a and eIF3c. The sequence of rabbit eIF3b has not been conclusively established (see Extended Data Fig. 16) and numbering therefore refers to human eIF3b. b, Overview of the process of sorting particle images. The population of each class is indicated by the number of particles and the percentage of the total number of particles at the beginning of each of the two classification rounds. The DHX29-bound 43S complex was processed from a total of ~650,000 particle images, which were first sorted into ten different classes. Class 2 (~125,000 particles) was sorted into ten subclasses, which are displayed in four different orientations, showing the intersubunit face, front, solvent side and bottom, respectively. Classes 2-7 and 9 from the second classification round were pooled and refined yielding a reconstruction presenting a variable resolution ranging from 4.5-15 Å (bottom right). d and f, Cryo-EM reconstruction of the 43S complex, colored according to the local resolution as measured using ResMap (see Methods). The red and black boxes correspond to close-up views of the eIF3 core viewed from (d) the intersubunit face and (f) the solvent face of the 40S subunit. c and e, CryoEM reconstruction of the eIF3 core after focused refinement, colored according to the local resolution as measured using ResMap. Maps in c-f are filtered to 6 Å.
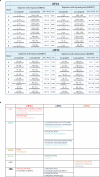
Extended Data Fig. 3. Peptide analysis of eIF3 a and c subunits after digestion and details of interactions between eIF3 and the 40S small ribosomal subunit
a, Peptide analysis of eIF3 a and c subunits, for each band of the gel the first and last identified peptides from eIF3 a and c subunits are indicated, after both types of digestions, in trypsin and chymotrypsin. The NanoLC-MS/MS analysis reveals the different forms of eIF3 a and c subunits in our in vitro reconstituted 43S preinitiation complex. #Spc = number of specters, #Peps = number of peptides. b, details of interactions between eIF3 and the 40S small ribosomal subunit. The name and sequential number of interacting residues on each side, eIF3 and the 40S, is given in the table. Residue names are colored variably to distinguish them according to their origin.
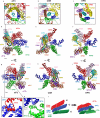
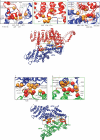
Extended Data Fig. 4. Comparison of the structure of the mammalian eIF3 core with the structures of the COP9 signalosome and 26S proteasome lid molecules
a-c, close-up views of the helical bundles of eIF3, COP9 and 26S lid molecules. d-i, All three molecules shown in two different orientations. Different constitutive subunits are labeled and colored variably. Homologous subunits among all three molecules are shaded using the same color in all panels. j and k, Additional quaternary interactions between eIF3a and eIF3c, and between eIF3c and eIF3e, which occur neither in COP9 nor in 26S lid molecules. l, Consequence of these additional quaternary interactions on the structure of eIF3 subunits a, c and e, schematized as rectangles. Black arrows around axes describe the rotation of the helical domains of subunits a, c and e relatively to their respective PCI domains, due to the existence of these additional quaternary interactions, compared to COP9 and 26S lid molecules.
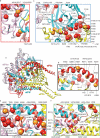
Extended Data Fig. 5. Conservation of quaternary interactions between eIF3a and eIF3c subunits, and between eIF3c and eIF3e subunits
a, ribbon representation of eIF3a and eIF3c subunits. b-d, Close-up views of contact regions between eIF3a and eIF3c. e, ribbon representation of eIF3 c and e subunits. f and g, Close-up views of contact regions between subunits c and e of eIF3. Red spheres represent residues at the interfaces that are conserved in eIF3 from six representative eukaryotic organisms; H. sapiens, C. elegans, A. thaliana, D. melanogaster, X. tropicalis, which are very different multicellular eukaryotic organisms, and N. crassa, a unicellular organism. These organisms all have a full complement of 13 eIF3 subunits. Orange spheres represent residues at the interfaces that are conserved only in the five multicellular eukaryotic organisms. The remaining residues that are suggested by the model and the density map to be involved in quaternary interactions are represented as ribbons in salmon color. Many of these other residues are conserved in three or four of the compared organisms, but almost all of them have conserved chemical properties.
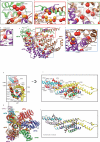
Extended Data Fig. 6. Conservation of quaternary interactions between eIF3 subunits a, m, f and h
a, In center, eIF3 a, m, f and h subunits. b-f, Close-up views of contact regions between subunits a, m, f and h of eIF3. Red spheres represent residues at the interfaces that are conserved in six representative eukaryotic organisms; H. sapiens, C. elegans, A. thaliana, D. melanogaster, X. tropicalis and the unicellular N. crassa. Orange spheres represent residues at the interfaces that are conserved only in the five multi-cellular eukaryotic organisms. The remaining residues that are suggested by the model and the density map to be involved in quaternary interactions are represented as ribbons in salmon color. Many of these other residues are conserved in three or four of the compared organisms, but almost all of them have conserved chemical properties.
Extended Data Fig. 7. Conservation of quaternary interactions between eIF3 subunits e, k and l, and between eIF3 subunits in the region of the helical bundle
a, ribbon representation of eIF3 e, k and l subunits. b-f, Close-up views of contact regions between subunits e, k and l of eIF3. g, ribbon representation of eIF3 octamer core. h, Close-up views of contact regions between subunits a, c, e, m, f, h, k and l of eIF3 in the helical bundle region, seen from the direction of the axis of the latter. i, Region displayed in b rotated by 90° Red spheres represent residues at the interfaces that are conserved in six representative eukaryotic organisms; H. sapiens, C. elegans, A. thaliana, D. melanogaster, X. tropicalis and the unicellular N. crassa. Orange spheres represent residues at the interfaces that are conserved only in the five multi-cellular eukaryotic organisms. The remaining residues that are suggested by the model and the density map to be involved in quaternary interactions are represented as ribbons in Salmon color. Many of these other residues are conserved in three or four of the compared organisms, but almost all of them have conserved chemical properties. j, Same view as in i displaying all the hydrophobic residues of the helical bundle region in silver ribbons. The abundance of hydrophobic residues in the helical bundle at the interfaces of different helices suggests the stabilization of the bundle though hydrophobic interactions, hence the low identity conservation of residues at the interfaces.
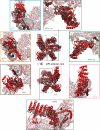
Extended Data Fig. 8. Comparison of the mammalian eIF3 core model built from the 6 Å cryo-EM reconstruction with a model based on low-resolution cryo-EM studies
In center, our polyalanine-level model of the mammalian eIF3 octamer core (represented in red ribbons) fitted on the atomic model proposed by Erzberger et al. (represented in dark gray ribbons), shown in two different orientations. The surrounding panels are close-up views of different constitutive subunits, highlighting significant structural differences between the previously proposed model and the model proposed in this study. Gold- and cyan-dashed ovals highlight the misassignment of several helices of the helical bundle belonging to the C-termini of subunits h and f, respectively, in the previously proposed model. Red-, green-dashed circles and black arrow highlight the absence in the previously proposed model of important structural features involved in quaternary interactions. In each panel, the remaining subunits of the eIF3 core octamer are faded out as transparent ribbons.
Extended Data Fig. 9. Sorting of particle images and focused classification of eIF3 peripheral subunits near the mRNA channel entrance and exit
a, Overview of the process of sorting particle images. The population of each class is indicated by the number of particles and the percentage of the total number of particles at the beginning of each of the classification rounds. After the first round of classification, class 2 stands out as the class displaying eIF3. Focused classification of eIF3 peripheral subunits, near the mRNA channel entrance, was performed by applying a smooth-edge mask corresponding to the shape of the concerned subunits of eIF3 and to a region of the 43S complex encompassing DHX29 and h16 of the 40S subunit. The mask is displayed as pink mesh. The resulting classes from the focused sorting of class 2 of the first classification round are displayed in two different orientations, front and solvent side, respectively. Class 6 from the second classification round presents the most solid and complete density of the peripheral subunits of eIF3 at this region of the complex, and it was therefore refined yielding a reconstruction presenting an average resolution of 7.1 Å. Cryo-EM reconstruction of eIF3b and eIF3i along with DHX29, colored by local resolution. b, After the first round of classification, on class 2, focused classification of an eIF3 peripheral subunit, identified as eIF3d, near the mRNA channel exit behind ribosomal protein RACK1, was performed by applying a smooth-edge mask corresponding to the shape of the concerned subunit of eIF3 and to a region of the head of the 40S subunit encompassing RACK1. The mask is displayed as pink mesh. The resulting classes from the focused sorting of class 2 of the first classification round are displayed in two different orientations, intersubunit face and top, respectively. Class 2 from the second round of classification presents the most solid and complete density of the peripheral subunit of eIF3 at this region of the complex, but due to some apparent heterogeneity in eIF3d, a third classification round was required, yielding four classes displaying a solid eIF3d subunit in slightly different conformations (other classes obtained in this third round of classification were completely empty and therefore not shown). The major class (39% of the particles in this round) yielded a reconstruction presenting an average resolution of 7.7 Å. Cryo-EM reconstruction of eIF3d, colored by local resolution.
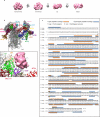
Extended Data Fig. 10. Shape and ribosomal binding site of eIF3d, and eIF3b sequence
a, Segmented cryo-EM reconstruction of the peripheral eIF3d subunit localized on the head of the 40S subunit, behind ribosomal protein RACK1, displayed at a high density threshold in order to show its most solid features, in four different orientations. b, eIF3d subunit in the context of the 43S preinitiation complex, seen from the back, showing the ribosomal proteins that contact it directly. This figure is complementary to Fig. 4c as it displays the same complex in a different orientation. This panel shows contacts between eIF3d subunit and ribosomal proteins eS28, uS7 and uS9. Contacts with RACK1 cannot be seen from this orientation. c, eIF3b sequence. The amino acid sequences of human eIF3b (GenBank NP_003742.2) and rabbit eIF3b (UniProt G1SZ03_RABIT) aligned using T_COFFEE (
http://www.ebi.ac.uk/Tools/msa/tcoffee/
) and annotated to show identity with tryptic and chymotryptic peptides derived from purified rabbit eIF3 and identified by nanoLC-MS/MS analysis. The complete sequence of rabbit eIF3b has not been determined, but clearly extends beyond the N-terminus of G1SZ03_RABIT, and we therefore used the numbering of residues in human eIF3b when referring in the text to elements of rabbit eIF3b.
Fig. 1. Structure of eIF3 core
a-c, Segmented eIF3 core, colored variably by subunit, seen from different orientations.d, Two-dimensional representation of the three-dimensional structure of the eIF3 octamer core. The helical bundle is represented by colored bars. Zigzagged line on eIF3c indicates possibly unstructured N-terminal tail. The eIF3a C-terminal region (not present in the structure reported here) is not shown in this schematic representation. e-g, Fitting of the eIF3 core model in its cryo-EM segmented density.
Fig. 2. Model of the eIF3 core
a and g, Close-up view of the 7-helix bundle formed by subunits h, c, e, l and k, seen in two orientations. b-f, Polyalanine-level model of the eIF3 octamer core seen from different orientations. c, Close-up view of β-sheet arc of the PCI domains of subunits m, a, c, e, k and l. The 7-helix bundle was cut out by fading it to highlight the arched β-sheet. h and i, Close-up views of additional quaternary contacts between eIF3a and eIF3c (panel h) and eIF3c and eIF3e (panel i).
Fig. 3. Contacts of the eIF3 core with the 40S subunit in the 43S complex
Solvent-side view of eIF3 bound to the DXH29-bound 43S complex. In black rectangle, close-up view of 40S/eIF3 core contacts. Colored arrowheads indicate the interaction of eIF3 core with ribosomal proteins and RNA.
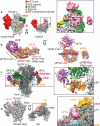
Fig. 4. Peripheral subunits of eIF3
a, Segmented cryo-EM reconstruction focused on eIF3 peripheral subunits localized near the mRNA channel entry, below DHX29, seen from the solvent face (left) and from below (middle). Close-up view of eIF3 peripheral subunits seen from below (right), with a red arrowhead indicating the connection with ES6S-hA and numbers indicating the blades of the β-propeller structure. b Atomic model of rabbit eIF3b (orange), yeast eIF3i (purple) and a long α-helix (red) corresponding to a fragment of the C-terminal helical region (‘eIF3a C-ter’). c, Left, front view of eIF3b and eIF3i subunits bound to the 40S subunit and DHX29 in the context of the 43S complex. The remaining, unmodeled third of DHX29 is denoted as a transparent green surface, based on its cryo-EM density. Right, close-up view of the contact points between eIF3b and DHX29. The panel also shows eIF3i's interaction with DHX29. d, Left, segmented cryo-EM reconstruction focused on an eIF3 peripheral subunit tentatively identified as eIF3d, localized on the 40S head behind ribosomal protein RACK1. Middle, the same reconstruction seen from above, rendered in transparent with the atomic model of the human 40S subunit fitted in. Right, close-up view of the putative eIF3d subunit. Red arrow indicates a density bridging the globular domain of eIF3d to a density corresponding to the eIF2α-D1 domain, part of the eIF2-TC (density colored in gold). Colored arrowheads indicate the interaction of eIF3 peripheral subunits with various ribosomal proteins.
Fig. 5. Schematic representation of the arrangement of initiation factors and their subunits in the DHX29-bound 43S complex
Figure includes only eIFs and subunits whose structures are known. The 40S subunit is depicted in gray surface; all other factors and subunits are labeled and colored variably. eIF3 helical bundles fortifying the intersubunit interactions are represented as cylinders. The 43S complex shown from a, the back, b, solvent side and c, front.
Similar articles
- Structure of the mammalian ribosomal 43S preinitiation complex bound to the scanning factor DHX29.
Hashem Y, des Georges A, Dhote V, Langlois R, Liao HY, Grassucci RA, Hellen CU, Pestova TV, Frank J. Hashem Y, et al. Cell. 2013 May 23;153(5):1108-19. doi: 10.1016/j.cell.2013.04.036. Cell. 2013. PMID: 23706745 Free PMC article. - eIF3 Peripheral Subunits Rearrangement after mRNA Binding and Start-Codon Recognition.
Simonetti A, Brito Querido J, Myasnikov AG, Mancera-Martinez E, Renaud A, Kuhn L, Hashem Y. Simonetti A, et al. Mol Cell. 2016 Jul 21;63(2):206-217. doi: 10.1016/j.molcel.2016.05.033. Epub 2016 Jun 30. Mol Cell. 2016. PMID: 27373335 - Hepatitis-C-virus-like internal ribosome entry sites displace eIF3 to gain access to the 40S subunit.
Hashem Y, des Georges A, Dhote V, Langlois R, Liao HY, Grassucci RA, Pestova TV, Hellen CU, Frank J. Hashem Y, et al. Nature. 2013 Nov 28;503(7477):539-43. doi: 10.1038/nature12658. Epub 2013 Nov 3. Nature. 2013. PMID: 24185006 Free PMC article. - The scanning mechanism of eukaryotic translation initiation.
Hinnebusch AG. Hinnebusch AG. Annu Rev Biochem. 2014;83:779-812. doi: 10.1146/annurev-biochem-060713-035802. Epub 2014 Jan 29. Annu Rev Biochem. 2014. PMID: 24499181 Review. - Molecular mechanisms of translation initiation in eukaryotes.
Pestova TV, Kolupaeva VG, Lomakin IB, Pilipenko EV, Shatsky IN, Agol VI, Hellen CU. Pestova TV, et al. Proc Natl Acad Sci U S A. 2001 Jun 19;98(13):7029-36. doi: 10.1073/pnas.111145798. Proc Natl Acad Sci U S A. 2001. PMID: 11416183 Free PMC article. Review.
Cited by
- Mutations in Nonessential eIF3k and eIF3l Genes Confer Lifespan Extension and Enhanced Resistance to ER Stress in Caenorhabditis elegans.
Cattie DJ, Richardson CE, Reddy KC, Ness-Cohn EM, Droste R, Thompson MK, Gilbert WV, Kim DH. Cattie DJ, et al. PLoS Genet. 2016 Sep 30;12(9):e1006326. doi: 10.1371/journal.pgen.1006326. eCollection 2016 Sep. PLoS Genet. 2016. PMID: 27690135 Free PMC article. - The structure of a human translation initiation complex reveals two independent roles for the helicase eIF4A.
Brito Querido J, Sokabe M, Díaz-López I, Gordiyenko Y, Fraser CS, Ramakrishnan V. Brito Querido J, et al. Nat Struct Mol Biol. 2024 Mar;31(3):455-464. doi: 10.1038/s41594-023-01196-0. Epub 2024 Jan 29. Nat Struct Mol Biol. 2024. PMID: 38287194 Free PMC article. - Phosphorylation of a reinitiation supporting protein, RISP, determines its function in translation reinitiation.
Mancera-Martínez E, Dong Y, Makarian J, Srour O, Thiébeauld O, Jamsheer M, Chicher J, Hammann P, Schepetilnikov M, Ryabova LA. Mancera-Martínez E, et al. Nucleic Acids Res. 2021 Jul 9;49(12):6908-6924. doi: 10.1093/nar/gkab501. Nucleic Acids Res. 2021. PMID: 34133725 Free PMC article. - Toward the mechanism of eIF4F-mediated ribosomal attachment to mammalian capped mRNAs.
Kumar P, Hellen CU, Pestova TV. Kumar P, et al. Genes Dev. 2016 Jul 1;30(13):1573-88. doi: 10.1101/gad.282418.116. Genes Dev. 2016. PMID: 27401559 Free PMC article. - Functional role and ribosomal position of the unique N-terminal region of DHX29, a factor required for initiation on structured mammalian mRNAs.
Sweeney TR, Dhote V, Guca E, Hellen CUT, Hashem Y, Pestova TV. Sweeney TR, et al. Nucleic Acids Res. 2021 Dec 16;49(22):12955-12969. doi: 10.1093/nar/gkab1192. Nucleic Acids Res. 2021. PMID: 34883515 Free PMC article.
References
- Hinnebusch AG. eIF3: a versatile scaffold for translation initiation complexes. Trends Biochem Sci. 2006;23:553–562. - PubMed
- Pena V, Liu S, Bujnicki JM, Lührmann R, Wahl MC. Structure of a multipartite protein-protein interaction domain in splicing factor prp8 and its link to retinitis pigmentosa. Mol Cell. 2007;25:615–624. - PubMed
Publication types
MeSH terms
Substances
Grants and funding
- R01 GM059660/GM/NIGMS NIH HHS/United States
- R01 GM029169/GM/NIGMS NIH HHS/United States
- R01 GM59660/GM/NIGMS NIH HHS/United States
- R01 GM29169/GM/NIGMS NIH HHS/United States
- HHMI/Howard Hughes Medical Institute/United States
LinkOut - more resources
Full Text Sources
Other Literature Sources
Molecular Biology Databases
Miscellaneous
