Deoxycholic acid modulates cell death signaling through changes in mitochondrial membrane properties - PubMed (original) (raw)
Deoxycholic acid modulates cell death signaling through changes in mitochondrial membrane properties
Tânia Sousa et al. J Lipid Res. 2015 Nov.
Abstract
Cytotoxic bile acids, such as deoxycholic acid (DCA), are responsible for hepatocyte cell death during intrahepatic cholestasis. The mechanisms responsible for this effect are unclear, and recent studies conflict, pointing to either a modulation of plasma membrane structure or mitochondrial-mediated toxicity through perturbation of mitochondrial outer membrane (MOM) properties. We conducted a comprehensive comparative study of the impact of cytotoxic and cytoprotective bile acids on the membrane structure of different cellular compartments. We show that DCA increases the plasma membrane fluidity of hepatocytes to a minor extent, and that this effect is not correlated with the incidence of apoptosis. Additionally, plasma membrane fluidity recovers to normal values over time suggesting the presence of cellular compensatory mechanisms for this perturbation. Colocalization experiments in living cells confirmed the presence of bile acids within mitochondrial membranes. Experiments with active isolated mitochondria revealed that physiologically active concentrations of DCA change MOM order in a concentration- and time-dependent manner, and that these changes preceded the mitochondrial permeability transition. Importantly, these effects are not observed on liposomes mimicking MOM lipid composition, suggesting that DCA apoptotic activity depends on features of mitochondrial membranes that are absent in protein-free mimetic liposomes, such as the double-membrane structure, lipid asymmetry, or mitochondrial protein environment. In contrast, the mechanism of action of cytoprotective bile acids is likely not associated with changes in cellular membrane structure.
Keywords: apoptosis; bile acids and salts; bile acids and salts/physical chemistry; fluorescence microscopy; membranes; membranes/fluidity; mitochondria.
Copyright © 2015 by the American Society for Biochemistry and Molecular Biology, Inc.
Figures
Fig. 1.
Concentration and time dependency of cellular viability and caspase-3-like activity of primary rat hepatocytes in the presence of cytotoxic and cytoprotective bile acids. Cells were isolated as described in Materials and Methods and treated with 100 μM (A, C) or 500 μM (B, D) of DCA (black) or the cytoprotective UDCA (gray)/TUDCA (white) bile acids. Both cellular viability (A, B) and caspase-3-like activity (C, D) in hepatocytes were measured with the ApoTox-Glo triplex assay. Values for both cellular viability and caspase-3-like activity are normalized to control samples from the respective time point. Results are expressed as mean ± SEM fold change of at least three independent experiments. * P < 0.05, ** P < 0.01, and *** P < 0.001 from the respective time point control.
Fig. 2.
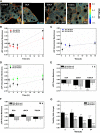
Changes in Laurdan GP values in membranes of rat hepatocytes in the presence of DCA and the cytoprotective UDCA/TUDCA bile acids. Laurdan GP values were calculated as described in Materials and Methods. GP images of hepatocytes after 30 min incubation with 100 μM of bile acids (A). Relative changes (ΔGP) between treated and untreated cultures of hepatocytes at different incubation times are shown (B–G). The impact of exposure to bile acids on GP values over time is shown for hepatocyte intracellular membranes in the presence of DCA (B), UDCA (C), and TUDCA (D) at both 100 and 500 μM. The impact of exposure to bile acids on hepatocyte plasma membrane GP values is shown both for 1 h (E) and 16 h (F) incubations. Time dependency of DCA toxicity on isolated hepatocytes at 100 μM (black) and 500 μM (gray) is also shown for comparison (G). Results are expressed as mean ± SEM fold change of at least 12 cells (B–F) or as mean ± SEM fold change of at least three independent experiments (G). * P < 0.05, ** P < 0.01, and *** P < 0.001 from the respective time point control.
Fig. 3.
Impact of DCA and cytoprotective bile acids UDCA/TUDCA on the membrane fluidity of HEK293T cells. HEK293T cells were loaded with either 5 µM of Laurdan (A) or 5 µM of di-4-ANEPPDHQ (D) after incubation with 100 µM of bile acids for 30 min at 37°C. Representative Laurdan GP (A) and di-4-ANEPPDHQ fluorescence lifetime (τ) (D) images are shown. Laurdan GP values, di-4-ANEPPDHQ fluorescence lifetimes, and the respective images were obtained as described in Materials and Methods. Average Laurdan GP values after incubation with bile acids are shown for both intracellular (B) and the plasma membranes (C). Average di-4-ANEPPDHQ fluorescence lifetimes are shown for the plasma membrane of HEK293T cells after treatment with bile acids for 30 min. (E). The impact of DCA on the plasma membrane fluidity on HEK293T cells is shown to be time dependent, as fluorescence lifetimes of di-4-ANEPPDHQ return to control values for incubations longer than 5 h (F). Only the value for the longer lifetime component (τ) of di-4-ANEPPDHQ fluorescence decay is shown (E, F) because this component corresponds to ∼97% total fluorescence intensity. Partial Chol extraction from the plasma membrane with 10 mM CD reduced the order of the plasma membrane as expected (CD), but the plasma membrane order remained insensitive to the presence of DCA, even after Chol extraction (CD + DCA). Average GP values are expressed as mean ± SEM from an average of 12 individual cells, and average di-4-ANEPPDHQ fluorescence lifetimes are the average of 50–100 cells.
Fig. 4.
Subcellular distribution of bile acid fluorescent analogs in hepatocytes. Representative confocal microscopy analysis of the subcellular distribution of DCA-NBD (A) and UDCA-NBD (D) in hepatocytes after internalization. Rat liver hepatocytes were incubated with 20 μM of bile acid analogs during 30 min at 37°C. Mitochondria were fluorescently stained with 5 μM Rho-123 for 15 min at 37°C (B, E). Overlay images are shown (C, F). Inset images show the presence of bile acid analogs in the outer mitochondrial membrane.
Fig. 5.
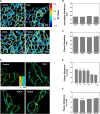
Subcellular distribution of DCA-NBD in HEK293T cells. Mitochondria or plasma membranes of HEK293T cells were fluorescently stained with 5 μM Rho-123 (mitochondrial marker) (A) and 130 nM A594-WGA (plasma membrane marker) (E), respectively. The subcellular distribution of 20 µM of DCA-NBD (B, F) in these cells after internalization is also shown by colocalization analysis. Overlay images for DCA-NBD fluorescence and mitochondria (C) or plasma membrane (G) staining are also shown. DCA-NBD distributes through different organelles, including mitochondria, as evidenced by colocalization with mitochondrial membrane marker. As a result, positive PDM (27) values are obtained within the mitochondria, while other intracellular organelles loaded with DCA-NBD present negative PDM values (D). Pearson correlation coefficients (Rr) (27) confirm partial colocalization between DCA-NBD and Rho-123 signals as well as poor colocalization of DCA-NBD with the plasma membrane marker A594-WGA (H). Partial Chol extraction with 10 mM CD did not increase incorporation of DCA-NBD in the plasma membrane (CD + A594-WGA) (H). Results are expressed as mean ± SEM of 50–60 cells.
Fig. 6.
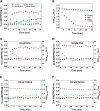
DCA induces changes in MOM structure, which precede the onset of MPT. Comparison between changes in membrane order of freshly isolated rat liver mitochondria over time after exposure to DCA (red), UDCA (blue), and TUDCA (green) at 100 μM (A). Mitochondrial membrane order in freshly isolated rat liver mitochondria was monitored through fluorescence anisotropy measurements of di-4-ANEPPDHQ after removal of unbound membrane probe by centrifugation. Control values (untreated samples) are shown in black. Detection of mitochondrial swelling after exposure of isolated rat liver mitochondria to DCA (red), UDCA (blue), and TUDCA (green) at 100 μM (B). Control values are shown in black. Mitochondrial swelling was detected through changes in optical density (OD) at 540 nm. Changes in the fluorescence anisotropy of di-4-ANEPPDHQ (red) and mitochondrial swelling (gray) for isolated mitochondria in the presence of 100 μM DCA (C) and 500 μM DCA (D). Results for mitochondrial membrane order (green) and mitochondrial swelling (gray) for isolated mitochondria in the presence of 100 μM TUDCA (E) and 500 μM TUDCA (F).Control values for di-4-ANEPPDHQ fluorescence anisotropy are shown in black.
Fig. 7.
Impact of bile acids on membrane fluidity and permeability of liposomes mimicking MOM composition. Fluorescence anisotropy measurements of di-4-ANEPPDHQ within protein-free liposomes mimicking MOM lipid composition (PC/PE/PI/CL/Chol, 48:25:12:6:9) (A). Measurements in the presence of 500 μM of DCA or UDCA were carried out after a 15 min incubation with the bile acid. MOM biomimetic liposomes were loaded with 90 mM CF (under fluorescence self-quenching conditions) and exposed for 1 h at room temperature to 100 μM of DCA, UDCA, and TUDCA at room temperature (B). Results are shown for the increase in CF leakage from liposomes. The increase in CF fluorescence intensity is proportional to the fraction of CF released and can be used to evaluate liposome permeability as described in Materials and Methods.
Similar articles
- Deoxycholic acid (DCA) causes ligand-independent activation of epidermal growth factor receptor (EGFR) and FAS receptor in primary hepatocytes: inhibition of EGFR/mitogen-activated protein kinase-signaling module enhances DCA-induced apoptosis.
Qiao L, Studer E, Leach K, McKinstry R, Gupta S, Decker R, Kukreja R, Valerie K, Nagarkatti P, El Deiry W, Molkentin J, Schmidt-Ullrich R, Fisher PB, Grant S, Hylemon PB, Dent P. Qiao L, et al. Mol Biol Cell. 2001 Sep;12(9):2629-45. doi: 10.1091/mbc.12.9.2629. Mol Biol Cell. 2001. PMID: 11553704 Free PMC article. - Membrane structural changes support the involvement of mitochondria in the bile salt-induced apoptosis of rat hepatocytes.
Solá S, Brito MA, Brites D, Moura JJ, Rodrigues CM. Solá S, et al. Clin Sci (Lond). 2002 Nov;103(5):475-85. doi: 10.1042/cs1030475. Clin Sci (Lond). 2002. PMID: 12401120 - Elevated cholesterol levels have a poor prognosis in a cholestasis scenario.
Nuño-Lámbarri N, Barbero-Becerra VJ, Uribe M, Chávez-Tapia NC. Nuño-Lámbarri N, et al. J Biochem Mol Toxicol. 2017 Jan;31(1):1-6. doi: 10.1002/jbt.21831. Epub 2016 Aug 12. J Biochem Mol Toxicol. 2017. PMID: 27517733 Review. - Milestones and recent discoveries on cell death mediated by mitochondria and their interactions with biologically active amines.
Grancara S, Ohkubo S, Artico M, Ciccariello M, Manente S, Bragadin M, Toninello A, Agostinelli E. Grancara S, et al. Amino Acids. 2016 Oct;48(10):2313-26. doi: 10.1007/s00726-016-2323-z. Epub 2016 Sep 12. Amino Acids. 2016. PMID: 27619911 Review.
Cited by
- Microbiome, bile acids, and obesity: How microbially modified metabolites shape anti-tumor immunity.
Sipe LM, Chaib M, Pingili AK, Pierre JF, Makowski L. Sipe LM, et al. Immunol Rev. 2020 May;295(1):220-239. doi: 10.1111/imr.12856. Immunol Rev. 2020. PMID: 32320071 Free PMC article. Review. - Genetic analysis of the role of the conserved inner membrane protein CvpA in EHEC resistance to deoxycholate.
Warr AR, Giorgio RT, Waldor MK. Warr AR, et al. J Bacteriol. 2020 Dec 23;203(6):e00661-20. doi: 10.1128/JB.00661-20. Online ahead of print. J Bacteriol. 2020. PMID: 33361192 Free PMC article. - Mitochondrial Function and Microbial Metabolites as Central Regulators of Intestinal Immune Responses and Cancer.
Weber-Stiehl S, Järke L, Castrillón-Betancur JC, Gilbert F, Sommer F. Weber-Stiehl S, et al. Front Microbiol. 2022 Jun 29;13:919424. doi: 10.3389/fmicb.2022.919424. eCollection 2022. Front Microbiol. 2022. PMID: 35847099 Free PMC article. - Bile acids in glucose metabolism and insulin signalling - mechanisms and research needs.
Ahmad TR, Haeusler RA. Ahmad TR, et al. Nat Rev Endocrinol. 2019 Dec;15(12):701-712. doi: 10.1038/s41574-019-0266-7. Epub 2019 Oct 15. Nat Rev Endocrinol. 2019. PMID: 31616073 Free PMC article. Review. - Talk to Me-Interplay between Mitochondria and Microbiota in Aging.
Endres K, Friedland K. Endres K, et al. Int J Mol Sci. 2023 Jun 28;24(13):10818. doi: 10.3390/ijms241310818. Int J Mol Sci. 2023. PMID: 37445995 Free PMC article. Review.
References
- Schmucker D. L., Ohta M., Kanai S., Sato Y. K. K. 1990. Hepatic injury induced by bile salts: correlation between biochemical and morphological events. Hepatology. 12: 1216–1221. - PubMed
- Yamazaki M., Miyake M., Sato H., Masutomi N., Tsutsui N., Adam K.-P., Alexander D. C., Lawton K. A., Milburn M. V., Ryals J. A., et al. 2013. Perturbation of bile acid homeostasis is an early pathogenesis event of drug induced liver injury in rats. Toxicol. Appl. Pharmacol. 268: 79–89. - PubMed
- Castro R. E., Amaral J. D., Solá S., Kren B. T., Steer C. J., Rodrigues C. M. P. 2007. Differential regulation of cyclin D1 and cell death by bile acids in primary rat hepatocytes. Am. J. Physiol. Gastrointest. Liver Physiol. 293: G327–G334. - PubMed
- Gumpricht E., Devereaux M. W., Dahl R. H., Sokol R. J. 2000. Glutathione status of isolated rat hepatocytes affects bile acid-induced cellular necrosis but not apoptosis. Toxicol. Appl. Pharmacol. 164: 102–111. - PubMed
Publication types
MeSH terms
Substances
LinkOut - more resources
Full Text Sources


