Transcriptional plasticity promotes primary and acquired resistance to BET inhibition - PubMed (original) (raw)
. 2015 Sep 24;525(7570):543-547.
doi: 10.1038/nature14898. Epub 2015 Sep 14.
Mareike Roth # 1, Tobias Neumann 1, Felix Muerdter 1, Jae-Seok Roe 2, Matthias Muhar 1, Sumit Deswal 1, Sabine Cerny-Reiterer 3 4, Barbara Peter 3 4, Julian Jude 1, Thomas Hoffmann 1, Łukasz M Boryń 1, Elin Axelsson 1, Norbert Schweifer 5, Ulrike Tontsch-Grunt 5, Lukas E Dow 6, Davide Gianni 5, Mark Pearson 5, Peter Valent 3 4, Alexander Stark 1, Norbert Kraut 5, Christopher R Vakoc 2, Johannes Zuber 1
Affiliations
- PMID: 26367798
- PMCID: PMC4921058
- DOI: 10.1038/nature14898
Transcriptional plasticity promotes primary and acquired resistance to BET inhibition
Philipp Rathert et al. Nature. 2015.
Abstract
Following the discovery of BRD4 as a non-oncogene addiction target in acute myeloid leukaemia (AML), bromodomain and extra terminal protein (BET) inhibitors are being explored as a promising therapeutic avenue in numerous cancers. While clinical trials have reported single-agent activity in advanced haematological malignancies, mechanisms determining the response to BET inhibition remain poorly understood. To identify factors involved in primary and acquired BET resistance in leukaemia, here we perform a chromatin-focused RNAi screen in a sensitive MLL-AF9;Nras(G12D)-driven AML mouse model, and investigate dynamic transcriptional profiles in sensitive and resistant mouse and human leukaemias. Our screen shows that suppression of the PRC2 complex, contrary to effects in other contexts, promotes BET inhibitor resistance in AML. PRC2 suppression does not directly affect the regulation of Brd4-dependent transcripts, but facilitates the remodelling of regulatory pathways that restore the transcription of key targets such as Myc. Similarly, while BET inhibition triggers acute MYC repression in human leukaemias regardless of their sensitivity, resistant leukaemias are uniformly characterized by their ability to rapidly restore MYC transcription. This process involves the activation and recruitment of WNT signalling components, which compensate for the loss of BRD4 and drive resistance in various cancer models. Dynamic chromatin immunoprecipitation sequencing and self-transcribing active regulatory region sequencing of enhancer profiles reveal that BET-resistant states are characterized by remodelled regulatory landscapes, involving the activation of a focal MYC enhancer that recruits WNT machinery in response to BET inhibition. Together, our results identify and validate WNT signalling as a driver and candidate biomarker of primary and acquired BET resistance in leukaemia, and implicate the rewiring of transcriptional programs as an important mechanism promoting resistance to BET inhibitors and, potentially, other chromatin-targeted therapies.
Conflict of interest statement
The authors declare no competing financial interests.
Figures
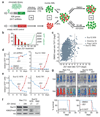
Figure 1. Multiplexed shRNAmir screening identifies chromatin factors that prevent resistance to BET inhibition.
a, Schematic of the multiplexed screening strategy. Mouse MLL/AF9;NrasG12D AML cells were infected with a library targeting 626 chromatin-associated genes (GFP+) or empty control (mCherry+). G418-selected cell populations were mixed and treated with DMSO or 100 nM JQ1 for 4 days followed by 50 nM JQ1 for 22 days. Genomic DNA isolated from T0, T1 and T2 was used to amplify and deep-sequence shRNA guides. b, Relative abundance of mCherry+ control cells and absolute number of GFP+/shRNA-expressing in the screen population cells over time. c, Scatter plot showing the average ratio of normalized reads before (T1) and after 26 days of DMSO- or JQ1 treatment (T2) for all 2917 shRNAs. d, e, Competitive proliferation assays of MLL/AF9;NrasG12D leukemia cells expressing the indicated shRNAs. Shown is the relative fraction of GFP+/shRNA+ cells relative to the initial measurement. After 10 days, each sample was split in half, treated with DMSO or 50 nM JQ1 and analyzed over 8 days. f, Immunoblotting of Suz12 and H3K27me3 in resistant AML cells expressing the indicated Suz12 shRNAs (LT, long-term culture in 50 nM JQ1 over 6 weeks) and Ren.713 control cells (+/- treatment with 200 nM JQ1 for 24h). g) Top, bioluminescent imaging of mice transplanted with 10 MLL/AF9;NrasG12D leukemia cells expressing the indicated shRNAs. Treatment with JQ1 (50 mg/kg/d) or DMSO carrier was initiated at day 3 after transplantation. Bottom, Kaplan–Meier survival curves of control and JQ1-treated mice (n=5). Statistical significance was calculated using a log-rank test.
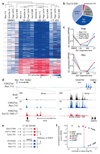
Figure 2. BET resistant AML cells restore the transcription of key Brd4 target genes through remodeling of regulatory landscapes and pathways.
a, Heat map showing RPKM fold-change (FC) of 235 response genes in MLL/AF9;NrasG12D leukemia cells expressing the indicated shRNAs after treatment with DMSO or JQ1 (200 nM) for 2h or 24h, and after long-term (LT) JQ1 treatment (50 nM) for 6 weeks. Response genes were defined based on JQ1-induced changes in Ren.713 expressing leukemia cells (FC>2/<0.5 after 2h and FC>2/<0.33 after 24h). Samples are presented according to non-hierarchical clustering; genes are grouped in up- or down-regulated targets in Ren.713 control cells, and sorted by their average re-expression in resistant leukemia. b, Response genes in (a) were grouped into four categories based on the divergence of their expression in resistant AML compared to AML expressing Ren.713 (see legend of Extended Data Fig. 2e for details). c, Time course of Tifab and Myc transcript levels in MLL/AF9;NrasG12D leukemia expressing the indicated shRNAs, relative to untreated cells expressing Ren.713. d, ChIPseq occupancy profiles of Brd4 and H3K27ac in Myc regulatory regions in sensitive AML cells (wt and Ren.713) and Suz12.1842-expressing resistant AML cells under long-term (LT) treatment with JQ1 (50 nM). The H3K27ac profile in Ren.713 control AML cells is shown on top for the entire region (~2 MB), together with validated transcript models from the mm10 genome assembly. Additional tracks are zoomed in on the proximal region and a distal region containing an established cluster of enhancers (E1-E5), as indicated (dotted lines). The y-axis reflects the number of normalized cumulative tag counts in each region. e, Schematic of RNA-seq profiling in resistant AML cells generated through expression of three independent shRNAs targeting Suz12 or Ezh2, which are treated as biological triplicates and compared to triplicate control cells. f, Gene set enrichment analysis (GSEA) of expression changes in 22 KEGG signaling pathways in resistant AML cells generated as described in (e). Plotted are normalized enrichment scores (NES) against nominal p-values; significantly altered gene sets (p<0.05) are indicated in the graph.
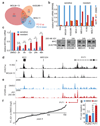
Figure 3. Dynamic transcriptional and enhancer profiling of sensitive and resistant cancer cell lines.
a, Venn diagram depicting the overlap of expression changes in 3 sensitive AML lines after 2h of JQ1 (200 nM). b, Top, MYC mRNA levels in indicated cell lines after 2h or 24h of JQ1 (200 nM), relative to DMSO-treated cells. Bottom, MYC immunoblotting in indicated cell lines before and after 24h of JQ1. c, MYC mRNA levels across 6 sensitive and 6 resistant cell lines at indicated time points following JQ1 (200 nM), normalized to DMSO (mean±SEM; Student’s _t_-test; **, p=0.01; ***, p<0.01). d, ChIPseq occupancy profiles of H3K27ac at the MYC locus in K-562 and MOLM-13 cells. Validated transcript models from the hg19 genome assembly are shown above; y-axes reflect normalized cumulative tag counts in each region. e, STARR-seq fragment densities in K-562 cells treated with DMSO or 250 nM JQ1. Read densities are shown as unique reads per million (rpm). f, Sorted ratios of STARR-seq signals in DMSO versus 250 nM JQ1-treated cells for all 156 identified STARR-seq peaks. g, Luciferase reporter assay measuring the enhancer activity of the PVT1 element and an unrelated enhancer (PLEK2) on a minimal MYC promoter. Shown are fold changes of normalized luciferase signal over background ± 250 nM JQ1 (n=3; mean±SEM, Student’s _t_-test with Welch’s correction).
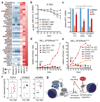
Figure 4. Wnt-signaling promotes primary and acquired BET resistance in leukemia.
a, Heat map of genes differentially expressed between indicated sensitive and resistant leukemia cell lines. Genes previously implicated as Wnt target genes are highlighted in red. b, Competitive proliferation assay of K-562 cells expressing the indicated shRNAs. Shown is the fraction of GFP+/shRNA+ under JQ1 treatment (100 nM), normalized to the fraction in DMSO-treated control cells (n=3, mean±SEM). c, qRT-PCR analysis of MYC mRNA levels in K-562 cells expressing the indicated shRNAs at different time points after JQ1 treatment (200 nM) (n=3; mean±SEM; Student’s _t_-test). d, Competitive proliferation assays of MLL/AF9;NrasG12D leukemia cells expressing the indicated shRNAs. Shown is the fraction of mCherry+/shRNA+ cells relative to the initial measurement. After 2 days, each sample was split in half, treated with DMSO or 50 nM JQ1 and followed up for 16 days. e, Competitive proliferation assays of MLL/AF9;NrasG12D leukemia cells co-expressing mCherry and Ctnnb1 harboring 1 (Ctnnb1.1x) or 4 (Ctnnb1.4x) activating mutations. After 2 days cells were treated with 50 nM JQ1 or DMSO, and the relative fraction of mCherry+/shRNA+ cells was followed over time. f, qRT-PCR analysis of TCF4, CCND2 and HOXB4 mRNA levels (relative to GAPDH) in sensitive (n=6; IC50<200 nM) and resistant (n=6; IC50>500 nM) primary human leukemia samples (Student’s _t_-test; *, p<0.05; **, p<0.01). g, Model of transcriptional plasticity as a driver of primary and acquired BET resistance.
Similar articles
- BET inhibitor resistance emerges from leukaemia stem cells.
Fong CY, Gilan O, Lam EY, Rubin AF, Ftouni S, Tyler D, Stanley K, Sinha D, Yeh P, Morison J, Giotopoulos G, Lugo D, Jeffrey P, Lee SC, Carpenter C, Gregory R, Ramsay RG, Lane SW, Abdel-Wahab O, Kouzarides T, Johnstone RW, Dawson SJ, Huntly BJ, Prinjha RK, Papenfuss AT, Dawson MA. Fong CY, et al. Nature. 2015 Sep 24;525(7570):538-42. doi: 10.1038/nature14888. Epub 2015 Sep 14. Nature. 2015. PMID: 26367796 Free PMC article. - Response and resistance to BET bromodomain inhibitors in triple-negative breast cancer.
Shu S, Lin CY, He HH, Witwicki RM, Tabassum DP, Roberts JM, Janiszewska M, Huh SJ, Liang Y, Ryan J, Doherty E, Mohammed H, Guo H, Stover DG, Ekram MB, Brown J, D'Santos C, Krop IE, Dillon D, McKeown M, Ott C, Qi J, Ni M, Rao PK, Duarte M, Wu SY, Chiang CM, Anders L, Young RA, Winer E, Letai A, Barry WT, Carroll JS, Long H, Brown M, Liu XS, Meyer CA, Bradner JE, Polyak K. Shu S, et al. Nature. 2016 Jan 21;529(7586):413-417. doi: 10.1038/nature16508. Epub 2016 Jan 6. Nature. 2016. PMID: 26735014 Free PMC article. - RNAi screen identifies Brd4 as a therapeutic target in acute myeloid leukaemia.
Zuber J, Shi J, Wang E, Rappaport AR, Herrmann H, Sison EA, Magoon D, Qi J, Blatt K, Wunderlich M, Taylor MJ, Johns C, Chicas A, Mulloy JC, Kogan SC, Brown P, Valent P, Bradner JE, Lowe SW, Vakoc CR. Zuber J, et al. Nature. 2011 Aug 3;478(7370):524-8. doi: 10.1038/nature10334. Nature. 2011. PMID: 21814200 Free PMC article. - The mechanisms behind the therapeutic activity of BET bromodomain inhibition.
Shi J, Vakoc CR. Shi J, et al. Mol Cell. 2014 Jun 5;54(5):728-36. doi: 10.1016/j.molcel.2014.05.016. Mol Cell. 2014. PMID: 24905006 Free PMC article. Review. - BRD4 and MYC: power couple in transcription and disease.
Kotekar A, Singh AK, Devaiah BN. Kotekar A, et al. FEBS J. 2023 Oct;290(20):4820-4842. doi: 10.1111/febs.16580. Epub 2022 Aug 3. FEBS J. 2023. PMID: 35866356 Free PMC article. Review.
Cited by
- Bromodomain-Containing Protein BRD4 Is Hyperphosphorylated in Mitosis.
Wang R, Yang JF, Ho F, Robertson ES, You J. Wang R, et al. Cancers (Basel). 2020 Jun 20;12(6):1637. doi: 10.3390/cancers12061637. Cancers (Basel). 2020. PMID: 32575711 Free PMC article. - Enhancer rewiring in tumors: an opportunity for therapeutic intervention.
Richart L, Bidard FC, Margueron R. Richart L, et al. Oncogene. 2021 May;40(20):3475-3491. doi: 10.1038/s41388-021-01793-7. Epub 2021 May 1. Oncogene. 2021. PMID: 33934105 Review. - Escape From Treatment; the Different Faces of Leukemic Stem Cells and Therapy Resistance in Acute Myeloid Leukemia.
van Gils N, Denkers F, Smit L. van Gils N, et al. Front Oncol. 2021 May 3;11:659253. doi: 10.3389/fonc.2021.659253. eCollection 2021. Front Oncol. 2021. PMID: 34012921 Free PMC article. Review. - Epigenetic therapies by targeting aberrant histone methylome in AML: molecular mechanisms, current preclinical and clinical development.
Tsai CT, So CW. Tsai CT, et al. Oncogene. 2017 Mar 30;36(13):1753-1759. doi: 10.1038/onc.2016.315. Epub 2016 Sep 5. Oncogene. 2017. PMID: 27593928 Free PMC article. Review. - Modulation of RNA splicing enhances response to BCL2 inhibition in leukemia.
Wang E, Pineda JMB, Kim WJ, Chen S, Bourcier J, Stahl M, Hogg SJ, Bewersdorf JP, Han C, Singer ME, Cui D, Erickson CE, Tittley SM, Penson AV, Knorr K, Stanley RF, Rahman J, Krishnamoorthy G, Fagin JA, Creger E, McMillan E, Mak CC, Jarvis M, Bossard C, Beaupre DM, Bradley RK, Abdel-Wahab O. Wang E, et al. Cancer Cell. 2023 Jan 9;41(1):164-180.e8. doi: 10.1016/j.ccell.2022.12.002. Epub 2022 Dec 22. Cancer Cell. 2023. PMID: 36563682 Free PMC article.
References
Publication types
MeSH terms
Substances
Grants and funding
- K22 CA181280/CA/NCI NIH HHS/United States
- 336860/ERC_/European Research Council/International
- F 4710/FWF_/Austrian Science Fund FWF/Austria
- P30 CA045508/CA/NCI NIH HHS/United States
- 242922/ERC_/European Research Council/International
LinkOut - more resources
Full Text Sources
Other Literature Sources
Medical
Research Materials
Miscellaneous


