Cerebrospinal fluid neurogranin: relation to cognition and neurodegeneration in Alzheimer's disease - PubMed (original) (raw)
Cerebrospinal fluid neurogranin: relation to cognition and neurodegeneration in Alzheimer's disease
Erik Portelius et al. Brain. 2015 Nov.
Abstract
Synaptic dysfunction is linked to cognitive symptoms in Alzheimer's disease. Thus, measurement of synapse proteins in cerebrospinal fluid may be useful biomarkers to monitor synaptic degeneration. Cerebrospinal fluid levels of the postsynaptic protein neurogranin are increased in Alzheimer's disease, including in the predementia stage of the disease. Here, we tested the performance of cerebrospinal fluid neurogranin to predict cognitive decline and brain injury in the Alzheimer's Disease Neuroimaging Initiative study. An in-house immunoassay was used to analyse neurogranin in cerebrospinal fluid samples from a cohort of patients who at recruitment were diagnosed as having Alzheimer's disease with dementia (n = 95) or mild cognitive impairment (n = 173), as well as in cognitively normal subjects (n = 110). Patients with mild cognitive impairment were grouped into those that remained cognitively stable for at least 2 years (stable mild cognitive impairment) and those who progressed to Alzheimer's disease dementia during follow-up (progressive mild cognitive impairment). Correlations were tested between baseline cerebrospinal fluid neurogranin levels and baseline and longitudinal cognitive impairment, brain atrophy and glucose metabolism within each diagnostic group. Cerebrospinal fluid neurogranin was increased in patients with Alzheimer's disease dementia (P < 0.001), progressive mild cognitive impairment (P < 0.001) and stable mild cognitive impairment (P < 0.05) compared with controls, and in Alzheimer's disease dementia (P < 0.01) and progressive mild cognitive impairment (P < 0.05) compared with stable mild cognitive impairment. In the mild cognitive impairment group, high baseline cerebrospinal fluid neurogranin levels predicted cognitive decline as reflected by decreased Mini-Mental State Examination (P < 0.001) and increased Alzheimer's Disease Assessment Scale-cognitive subscale (P < 0.001) scores at clinical follow-up. In addition, high baseline cerebrospinal fluid neurogranin levels in the mild cognitive impairment group correlated with longitudinal reductions in cortical glucose metabolism (P < 0.001) and hippocampal volume (P < 0.001) at clinical follow-up. Furthermore, within the progressive mild cognitive impairment group, elevated cerebrospinal fluid neurogranin levels were associated with accelerated deterioration in Alzheimer's Disease Assessment Scale-cognitive subscale (β = 0.0017, P = 0.01). These data demonstrate that cerebrospinal fluid neurogranin is increased already at the early clinical stage of Alzheimer's disease and predicts cognitive deterioration and disease-associated changes in metabolic and structural biomarkers over time.
Keywords: Alzheimer’s disease; biomarker; cerebrospinal fluid; mild cognitive impairment; neurogranin.
© The Author (2015). Published by Oxford University Press on behalf of the Guarantors of Brain. All rights reserved. For Permissions, please email: journals.permissions@oup.com.
Figures
Synaptic dysfunction precedes neurodegeneration and cognitive impairment in Alzheimer’s disease. Portelius et al. show that CSF levels of the postsynaptic protein neurogranin are increased in early-stage Alzheimer’s disease, and that the increase predicts cognitive deterioration and disease-associated changes in metabolic and structural biomarkers over time.
Figure 1
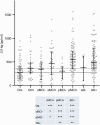
CSF neurogranin levels in different diagnostic groups. (A) Scatter plots showing CSF neurogranin levels in healthy control, stable MCI (sMCI), progressive MCI (pMCI) and Alzheimer’s disease (AD). Among the healthy control subjects, 32 individuals progressed to MCI or Alzheimer’s disease dementia during follow-up (progressive healthy controls) (B). The data are presented as medians and interquartile ranges. Differences between groups were assessed by linear regression, adjusted for age and sex. *P < 0.05; **P < 0.01; ***P < 0.0001.
Figure 2
Scatter plot showing the subjects included in the study classified as amyloid positive (+) or negative (−) based on a previously established cut-off (CSF amyloid-β42 < 192 pg/ml). The data are presented as medians and interquartile ranges. Differences between groups were assessed by linear regression, adjusted for age and sex. *P < 0.05; **P < 0.01; ***P < 0.001. Ng = neurogranin.
Figure 3
CSF neurogranin levels in relation to tau biomarkers. Correlations between CSF neurogranin levels and total tau and phosphorylated tau in healthy control (A), stable MCI (B), progressive MCI (C) and Alzheimer’s disease (D). Open circles and the solid line represent the correlation between total tau and neurogranin while closed circles and the dashed line represents the correlation between phosphorylated tau and neurogranin. The association between neurogranin and total and phosphorylated tau was investigated with Spearman’s correlation. The regression lines in the figures are only for visualization.
Figure 4
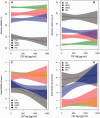
CSF neurogranin in relation to cognition and future cognitive change. MMSE and ADAS-Cog at baseline (A and B) and over time (C and D) as a function of baseline CSF neurogranin (Ng) in different diagnostic groups. Shaded areas indicate 95% confidence interval (CI) of the mean. CN = cognitively normal (green); sMCI = stable MCI (red); pMCI = progressive MCI (blue); AD = Alzheimer’s disease (grey).
Figure 5
CSF neurogranin in relation to brain structure and cognition. Hippocampal volume and FDG-PET at baseline (A and B) and over time (C and D) as a function of baseline CSF neurogranin in different diagnostic groups. Shaded areas indicate 95% CI of the mean. CN = cognitively normal (green); sMCI = stable MCI (red); pMCI = progressive MCI (blue); AD = Alzheimer’s disease (grey).
Figure 6
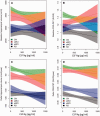
CSF neurogranin as a predictor of disease progression. The patients were divided into quartiles according to CSF neurogranin levels at baseline. All trend lines were calculated using local regression. (A) Patients with higher levels of CSF neurogranin at baseline have faster disease progression over time as measured by change in MMSE scores. Quartile 1: n = 43, quartile 2: n = 43, quartile 3: n = 42 and quartile 4: n = 45. (B) Patients with higher levels of CSF neurogranin at baseline have faster disease progression over time as measured by change in ADAS-Cog scores. However, Q2 and Q1 overlap. Quartile 1: n = 43, quartile 2: n = 43, quartile 3: n = 42 and quartile 4: n = 45. (C) Generally, patients with higher levels of CSF neurogranin at baseline have faster disease progression over time as measured by hippocampal volume change. However, the patients with the highest levels of CSF neurogranin (Q4) progress slower than Q3. Quartile 1: n = 43, quartile 2: n = 42, quartile 3: n = 42 and quartile 4: n = 43. (D) Patients with higher levels of CSF neurogranin at baseline have faster disease progression over time as measured by change in FDG-PET signals. However, Q3 and Q4 overlap. Quartile 1: n = 19, quartile 2: n = 26, quartile 3: n = 21 and quartile 4: n = 22. SUVR=standardized uptake value ratio.
Comment in
- Alzheimer disease: neurogranin in the CSF signals early Alzheimer disease and predicts disease progression.
Fyfe I. Fyfe I. Nat Rev Neurol. 2015 Nov;11(11):609. doi: 10.1038/nrneurol.2015.178. Epub 2015 Sep 29. Nat Rev Neurol. 2015. PMID: 26416540 No abstract available.
Similar articles
- Association of cerebrospinal fluid neurogranin levels with cognition and neurodegeneration in Alzheimer's disease.
Xue M, Sun FR, Ou YN, Shen XN, Li HQ, Huang YY, Dong Q, Tan L, Yu JT; Alzheimer’s Disease Neuroimaging Initiative. Xue M, et al. Aging (Albany NY). 2020 May 18;12(10):9365-9379. doi: 10.18632/aging.103211. Epub 2020 May 18. Aging (Albany NY). 2020. PMID: 32421689 Free PMC article. - Association Between Longitudinal Plasma Neurofilament Light and Neurodegeneration in Patients With Alzheimer Disease.
Mattsson N, Cullen NC, Andreasson U, Zetterberg H, Blennow K. Mattsson N, et al. JAMA Neurol. 2019 Jul 1;76(7):791-799. doi: 10.1001/jamaneurol.2019.0765. JAMA Neurol. 2019. PMID: 31009028 Free PMC article. - Cerebrospinal fluid synaptosomal-associated protein 25 is a key player in synaptic degeneration in mild cognitive impairment and Alzheimer's disease.
Zhang H, Therriault J, Kang MS, Ng KP, Pascoal TA, Rosa-Neto P, Gauthier S; Alzheimer’s Disease Neuroimaging Initiative. Zhang H, et al. Alzheimers Res Ther. 2018 Aug 16;10(1):80. doi: 10.1186/s13195-018-0407-6. Alzheimers Res Ther. 2018. PMID: 30115118 Free PMC article. - A meta-analysis on CSF neurogranin levels for the diagnosis of Alzheimer's disease and mild cognitive impairment.
Mavroudis IA, Petridis F, Chatzikonstantinou S, Kazis D. Mavroudis IA, et al. Aging Clin Exp Res. 2020 Sep;32(9):1639-1646. doi: 10.1007/s40520-019-01326-z. Epub 2019 Aug 28. Aging Clin Exp Res. 2020. PMID: 31463927 Review. - The prognostic utility of CSF neurogranin in predicting future cognitive decline in the Alzheimer's disease continuum: A systematic review and meta-analysis with narrative synthesis.
Yoong SQ, Lu J, Xing H, Gyanwali B, Tan YQ, Wu XV. Yoong SQ, et al. Ageing Res Rev. 2021 Dec;72:101491. doi: 10.1016/j.arr.2021.101491. Epub 2021 Oct 21. Ageing Res Rev. 2021. PMID: 34688925 Review.
Cited by
- Modern Approaches to the Diagnosis of Cognitive Impairment and Alzheimer's Disease: A Narrative Literature Review.
Ochneva AG, Soloveva KP, Savenkova VI, Ikonnikova AY, Gryadunov DA, Andryuschenko AV. Ochneva AG, et al. Consort Psychiatr. 2023 Mar 31;4(1):53-62. doi: 10.17816/CP716. Consort Psychiatr. 2023. PMID: 38239570 Free PMC article. Review. - CSF profiling of the human brain enriched proteome reveals associations of neuromodulin and neurogranin to Alzheimer's disease.
Remnestål J, Just D, Mitsios N, Fredolini C, Mulder J, Schwenk JM, Uhlén M, Kultima K, Ingelsson M, Kilander L, Lannfelt L, Svenningsson P, Nellgård B, Zetterberg H, Blennow K, Nilsson P, Häggmark-Månberg A. Remnestål J, et al. Proteomics Clin Appl. 2016 Dec;10(12):1242-1253. doi: 10.1002/prca.201500150. Epub 2016 Oct 10. Proteomics Clin Appl. 2016. PMID: 27604409 Free PMC article. - Cerebrospinal fluid neurogranin as a new player in prion disease diagnosis and prognosis.
Villar-Pique A, Zerr I, Llorens F. Villar-Pique A, et al. Neural Regen Res. 2020 May;15(5):861-862. doi: 10.4103/1673-5374.268901. Neural Regen Res. 2020. PMID: 31719249 Free PMC article. No abstract available. - The intact postsynaptic protein neurogranin is reduced in brain tissue from patients with familial and sporadic Alzheimer's disease.
Kvartsberg H, Lashley T, Murray CE, Brinkmalm G, Cullen NC, Höglund K, Zetterberg H, Blennow K, Portelius E. Kvartsberg H, et al. Acta Neuropathol. 2019 Jan;137(1):89-102. doi: 10.1007/s00401-018-1910-3. Epub 2018 Sep 22. Acta Neuropathol. 2019. PMID: 30244311 Free PMC article. - Emerging cerebrospinal fluid biomarkers in autosomal dominant Alzheimer's disease.
Schindler SE, Li Y, Todd KW, Herries EM, Henson RL, Gray JD, Wang G, Graham DL, Shaw LM, Trojanowski JQ, Hassenstab JJ, Benzinger TLS, Cruchaga C, Jucker M, Levin J, Chhatwal JP, Noble JM, Ringman JM, Graff-Radford NR, Holtzman DM, Ladenson JH, Morris JC, Bateman RJ, Xiong C, Fagan AM; Dominantly Inherited Alzheimer Network. Schindler SE, et al. Alzheimers Dement. 2019 May;15(5):655-665. doi: 10.1016/j.jalz.2018.12.019. Epub 2019 Mar 4. Alzheimers Dement. 2019. PMID: 30846386 Free PMC article.
References
- Alvarez-Bolado G, Rodriguez-Sanchez P, Tejero-Diez P, Fairen A, Diez-Guerra FJ. Neurogranin in the development of the rat telencephalon. Neuroscience 1996; 73: 565–80. - PubMed
- Baudier J, Deloulme JC, Van Dorsselaer A, Black D, Matthes HW. Purification and characterization of a brain-specific protein kinase C substrate, neurogranin (p17). Identification of a consensus amino acid sequence between neurogranin and neuromodulin (GAP43) that corresponds to the protein kinase C phosphorylation site and the calmodulin-binding domain. J Biol Chem 1991; 266: 229–37. - PubMed
- Bertoni-Freddari C, Fattoretti P, Casoli T, Caselli U, Meier-Ruge W. Deterioration threshold of synaptic morphology in aging and senile dementia of Alzheimer’s type. Anal Quant Cytol Histol 1996; 18: 209–13. - PubMed
- Blennow K, Bogdanovic N, Alafuzoff I, Ekman R, Davidsson P. Synaptic pathology in Alzheimer’s disease: relation to severity of dementia, but not to senile plaques, neurofibrillary tangles, or the ApoE4 allele. J Neural Transm 1996; 103: 603–18. - PubMed
- Blennow K, Hampel H, Weiner M, Zetterberg H. Cerebrospinal fluid and plasma biomarkers in Alzheimer disease. Nat Rev Neurol 2010; 6: 131–44. - PubMed
Publication types
MeSH terms
Substances
LinkOut - more resources
Full Text Sources
Other Literature Sources
Medical


