The effect of malaria control on Plasmodium falciparum in Africa between 2000 and 2015 - PubMed (original) (raw)
. 2015 Oct 8;526(7572):207-211.
doi: 10.1038/nature15535. Epub 2015 Sep 16.
D J Weiss # 1, E Cameron # 1, D Bisanzio 1, B Mappin 1, U Dalrymple 1, K Battle 1, C L Moyes 1, A Henry 1, P A Eckhoff 2, E A Wenger 2, O Briët 3 4, M A Penny 3 4, T A Smith 3 4, A Bennett 5, J Yukich 6, T P Eisele 6, J T Griffin 7, C A Fergus 8, M Lynch 8, F Lindgren 9, J M Cohen 10, C L J Murray 11, D L Smith 1 11 12 13, S I Hay 11 13 14, R E Cibulskis 8, P W Gething 1
Affiliations
- PMID: 26375008
- PMCID: PMC4820050
- DOI: 10.1038/nature15535
The effect of malaria control on Plasmodium falciparum in Africa between 2000 and 2015
S Bhatt et al. Nature. 2015.
Abstract
Since the year 2000, a concerted campaign against malaria has led to unprecedented levels of intervention coverage across sub-Saharan Africa. Understanding the effect of this control effort is vital to inform future control planning. However, the effect of malaria interventions across the varied epidemiological settings of Africa remains poorly understood owing to the absence of reliable surveillance data and the simplistic approaches underlying current disease estimates. Here we link a large database of malaria field surveys with detailed reconstructions of changing intervention coverage to directly evaluate trends from 2000 to 2015, and quantify the attributable effect of malaria disease control efforts. We found that Plasmodium falciparum infection prevalence in endemic Africa halved and the incidence of clinical disease fell by 40% between 2000 and 2015. We estimate that interventions have averted 663 (542-753 credible interval) million clinical cases since 2000. Insecticide-treated nets, the most widespread intervention, were by far the largest contributor (68% of cases averted). Although still below target levels, current malaria interventions have substantially reduced malaria disease incidence across the continent. Increasing access to these interventions, and maintaining their effectiveness in the face of insecticide and drug resistance, should form a cornerstone of post-2015 control strategies.
Figures
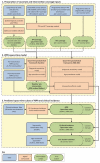
Extended Data Figure 1. Schematic overview of main input data, model components, and outputs
Each component is detailed in the Supplementary Information.
Extended Data Figure 2. Fitted function representing effect of ITNs
Curves illustrate the predicted effect of ITNs as a function of coverage (five example coverage levels are shown, specified as mean coverage over preceding 4-year period) and baseline transmission. The baseline _Pf_PR is shown on the horizontal axis and the suppressed _Pf_PR given the ITN coverage level shown on the vertical axis. The diagonal line (representing zero ITN effect) is shown in black, and parameter uncertainty around each ITN effect line is illustrated by the semi-transparent envelopes. Results shown are derived from a Bayesian geostatistical model fitted to: n = 27,573 PfPR survey points; n = 24,868 ITN survey points; n = 96 national survey reports of ACT coverage; n = 688 country-year reports on ITN, ACT and IRS distribution by national programs; and n = 20 environmental and socioeconomic covariate grids.
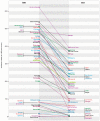
Extended Data Figure 3. Changing incidence rate by country, 2000–2015
Estimated country-level rates of all-age clinical incidence are shown for 2000 and 2015. For Sudan and South Sudan, we used the post-2011 borders throughout the time period to allow comparability. Results shown are derived from a Bayesian geostatistical model fitted to: n = 27,573 _Pf_PR survey points; n = 24,868 ITN survey points; n = 96 national survey reports of ACT coverage; n = 688 country-year reports on ITN, ACT and IRS distribution by national programs; n = 20 environmental and socioeconomic covariate grids; and n = 30 active-case detection studies reporting P. falciparum clinical incidence.
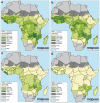
Extended Data Figure 4. Decline in infection prevalence attributable to main malaria control interventions
a–d, Each map shows absolute decline in _Pf_PR2-10 between 2000 and 2015 within areas of stable transmission attributable to the combined effect of ITNs, ACTs, and IRS (a); and the individual effect of ITNs (b); ACTs (c); and IRS (d) Note that the colour scaling differs between the panels. Results shown in all panels are derived from a Bayesian geostatistical model fitted to: n = 27,573 _Pf_PR survey points; n = 24,868 ITN survey points; n = 96 national survey reports of ACT coverage; n = 688 country-year reports on ITN, ACT and IRS distribution by national programs; and n = 20 environmental and socioeconomic covariate grids. Maps in this figure are available from the Malaria Atlas Project (
) under the Creative Commons Attribution 3.0 Unported License.
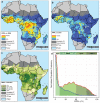
Figure 1. Changes in infection prevalence 2000–2015
a, _Pf_PR2-10 for the year 2000 predicted at 5×5 km resolution. b, _Pf_PR2-10 for the year 2015 predicted at 5×5 km resolution. c, Absolute reduction in _Pf_PR2-10 from 2000 to 2015. d, Smoothed density plot showing the relative distribution of endemic populations by _Pf_PR2-10 in the years 2000 (red line) and 2015 (blue line). The frequencies on the vertical axis have been scaled to make the densities visually comparable. The classical endemicity categories are shown for reference in green shades. Results shown in all panels are derived from a Bayesian geostatistical model fitted to: n = 27,573 _Pf_PR survey points; n = 24,868 ITN survey points; n = 96 national survey reports of ACT coverage; n = 688 country-year reports on ITN, ACT and IRS distribution by national programs; and n = 20 environmental and socioeconomic covariate grids. Maps in a–c are available from the Malaria Atlas Project (
) under the CreativeCommons Attribution 3.0 Unported License.
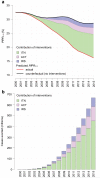
Figure 2. Changing endemicity and effect of interventions 2000–2015
a, Predicted time series of population-weighted mean _Pf_PR2-10 across endemic Africa. The red line shows the actual prediction and the black line a ‘counterfactual’ prediction in a scenario without coverage by ITNs, ACTs, or IRS. The coloured regions indicate the relative contribution of each intervention in reducing _Pf_PR2-10 throughout the period. b, The predicted cumulative number of clinical cases averted by interventions at the end of each year, with the specific contribution of each intervention distinguished. Results shown in both panels are derived from a Bayesian geostatistical model fitted to: n = 27,573 _Pf_PR survey points; n = 24,868 ITN survey points; n = 96 national survey reports of ACT coverage; n = 688 country-year reports on ITN, ACT and IRS distribution by national programs; and n = 20 environmental and socioeconomic covariate grids. Panel b additionally incorporates data from n = 30 active-case detection studies reporting P. falciparum clinical incidence.
Comment in
- Malaria: Fifteen years of interventions.
Hemingway J. Hemingway J. Nature. 2015 Oct 8;526(7572):198-9. doi: 10.1038/526198a. Nature. 2015. PMID: 26450051 No abstract available.
Similar articles
- The Effect of Indoor Residual Spraying on the Prevalence of Malaria Parasite Infection, Clinical Malaria and Anemia in an Area of Perennial Transmission and Moderate Coverage of Insecticide Treated Nets in Western Kenya.
Gimnig JE, Otieno P, Were V, Marwanga D, Abong'o D, Wiegand R, Williamson J, Wolkon A, Zhou Y, Bayoh MN, Lobo NF, Laserson K, Kariuki S, Hamel MJ. Gimnig JE, et al. PLoS One. 2016 Jan 5;11(1):e0145282. doi: 10.1371/journal.pone.0145282. eCollection 2016. PLoS One. 2016. PMID: 26731524 Free PMC article. - Folic acid supplementation and malaria susceptibility and severity among people taking antifolate antimalarial drugs in endemic areas.
Crider K, Williams J, Qi YP, Gutman J, Yeung L, Mai C, Finkelstain J, Mehta S, Pons-Duran C, Menéndez C, Moraleda C, Rogers L, Daniels K, Green P. Crider K, et al. Cochrane Database Syst Rev. 2022 Feb 1;2(2022):CD014217. doi: 10.1002/14651858.CD014217. Cochrane Database Syst Rev. 2022. PMID: 36321557 Free PMC article. - Risk of Plasmodium falciparum infection in south-west Burkina Faso: potential impact of expanding eligibility for seasonal malaria chemoprevention.
Yaro JB, Tiono AB, Ouedraogo A, Lambert B, Ouedraogo ZA, Diarra A, Traore A, Lankouande M, Soulama I, Sanou A, Worrall E, Agboraw E, Sagnon N, Ranson H, Churcher TS, Lindsay SW, Wilson AL. Yaro JB, et al. Sci Rep. 2022 Jan 26;12(1):1402. doi: 10.1038/s41598-022-05056-7. Sci Rep. 2022. PMID: 35082312 Free PMC article. - Chemoresistance in falciparum malaria.
May J, Meyer CG. May J, et al. Trends Parasitol. 2003 Oct;19(10):432-5; discussion 435-6. doi: 10.1016/j.pt.2003.08.001. Trends Parasitol. 2003. PMID: 14519577 Review. No abstract available. - Malaria in 2002.
Greenwood B, Mutabingwa T. Greenwood B, et al. Nature. 2002 Feb 7;415(6872):670-2. doi: 10.1038/415670a. Nature. 2002. PMID: 11832954 Review.
Cited by
- Pyrethroid and Carbamate Resistance in Anopheles funestus Giles along Lake Kariba in Southern Zambia.
Chanda J, Saili K, Phiri F, Stevenson JC, Mwenda M, Chishimba S, Mulube C, Mambwe B, Lungu C, Earle D, Bennett A, Eisele TP, Kamuliwo M, Steketee RW, Keating J, Miller JM, Sikaala CH. Chanda J, et al. Am J Trop Med Hyg. 2020 Aug;103(2_Suppl):90-97. doi: 10.4269/ajtmh.19-0664. Am J Trop Med Hyg. 2020. PMID: 32618244 Free PMC article. - Dengue and Zika Viruses: Epidemiological History, Potential Therapies, and Promising Vaccines.
Silva NM, Santos NC, Martins IC. Silva NM, et al. Trop Med Infect Dis. 2020 Sep 23;5(4):150. doi: 10.3390/tropicalmed5040150. Trop Med Infect Dis. 2020. PMID: 32977703 Free PMC article. Review. - Anopheles gambiae s.l. swarms trapping as a complementary tool against residual malaria transmission in eastern Gambia.
Assogba BS, Sillah S, Opondo KO, Cham ST, Camara MM, Jadama L, Camara L, Ndiaye A, Wathuo M, Jawara M, Diabaté A, Achan J, D'Alessandro U. Assogba BS, et al. Sci Rep. 2022 Oct 12;12(1):17057. doi: 10.1038/s41598-022-21577-7. Sci Rep. 2022. PMID: 36224312 Free PMC article. - Infectivity of patent Plasmodium falciparum gametocyte carriers to mosquitoes: establishing capacity to investigate the infectious reservoir of malaria in a low-transmission setting in The Gambia.
Ahmad A, Soumare HM, Camara MM, Jadama L, Gaye PM, Bittaye H, Bradley J, Achan J, Bousema T, D'Alessandro U, Drakeley C, Moreno M. Ahmad A, et al. Trans R Soc Trop Med Hyg. 2021 Dec 2;115(12):1462-1467. doi: 10.1093/trstmh/trab087. Trans R Soc Trop Med Hyg. 2021. PMID: 34107048 Free PMC article. - Malaria infection and its association with socio-demographics, preventive measures, and co-morbid ailments among adult febrile patients in rural Southwestern Nigeria: A cross-sectional study.
Ibrahim AO, Bello IS, Shabi OM, Omonijo AO, Ayodapo A, Afolabi BA. Ibrahim AO, et al. SAGE Open Med. 2022 Aug 22;10:20503121221117853. doi: 10.1177/20503121221117853. eCollection 2022. SAGE Open Med. 2022. PMID: 36051785 Free PMC article.
References
- World Health Organization . World Malaria Report 2014. World Health Organization; Geneva: 2014.
- Roll Back Malaria Partnership. World Health Organization . Global Malaria Action Plan 1 (2000-2015) World Health Organization; Geneva: 2008.
- World Health Organization . Global Technical Strategy for Malaria 2016–2030. World Health Organization; Geneva: 2015.
- Roll Back Malaria Partnership. World Health Organization . Action and Investment to Defeat Malaria 2016-2030. World Health Organization on behalf of the Roll Back Malaria Partnership Secretariat; Geneva: 2015.
Publication types
MeSH terms
Substances
Grants and funding
- MR/K00669X/1/MRC_/Medical Research Council/United Kingdom
- 095066/WT_/Wellcome Trust/United Kingdom
- WT_/Wellcome Trust/United Kingdom
- 001/WHO_/World Health Organization/International
- G1002284/MRC_/Medical Research Council/United Kingdom
LinkOut - more resources
Full Text Sources
Other Literature Sources
