Molecular identity of human outer radial glia during cortical development - PubMed (original) (raw)
. 2015 Sep 24;163(1):55-67.
doi: 10.1016/j.cell.2015.09.004.
Tomasz J Nowakowski 2, Jiadong Chen 2, Hanna Retallack 2, Carmen Sandoval-Espinosa 2, Cory R Nicholas 3, Joe Shuga 4, Siyuan John Liu 2, Michael C Oldham 3, Aaron Diaz 5, Daniel A Lim 5, Anne A Leyrat 4, Jay A West 4, Arnold R Kriegstein 6
Affiliations
- PMID: 26406371
- PMCID: PMC4583716
- DOI: 10.1016/j.cell.2015.09.004
Molecular identity of human outer radial glia during cortical development
Alex A Pollen et al. Cell. 2015.
Abstract
Radial glia, the neural stem cells of the neocortex, are located in two niches: the ventricular zone and outer subventricular zone. Although outer subventricular zone radial glia may generate the majority of human cortical neurons, their molecular features remain elusive. By analyzing gene expression across single cells, we find that outer radial glia preferentially express genes related to extracellular matrix formation, migration, and stemness, including TNC, PTPRZ1, FAM107A, HOPX, and LIFR. Using dynamic imaging, immunostaining, and clonal analysis, we relate these molecular features to distinctive behaviors of outer radial glia, demonstrate the necessity of STAT3 signaling for their cell cycle progression, and establish their extensive proliferative potential. These results suggest that outer radial glia directly support the subventricular niche through local production of growth factors, potentiation of growth factor signals by extracellular matrix proteins, and activation of self-renewal pathways, thereby enabling the developmental and evolutionary expansion of the human neocortex.
Copyright © 2015 Elsevier Inc. All rights reserved.
Figures
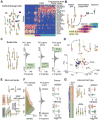
Figure 1. Molecular Diversity of Single Cells from Human Cortical Germinal Zone
(A) Schematic representation of major cell populations of developing cortex. VZ- ventricular zone, SVZ- subventricular zone, IZ- intermediate zone, SP- subplate, CP- cortical plate, MZ- marginal zone. (B) Representation of transcriptional heterogeneity of germinal zone cells profiled by single cell mRNA-Seq. Cells are arranged according to their position determined using t-distributed stochastic neighbor embedding. (C) Heatmap showing gene expression levels for 1% of genes most strongly contributing to PC1-4. Select marker genes are highlighted. Groups represent clusters with highest approximately unbiased p-values following multiscale bootstrapping of hierarchical clustering based on expectation-maximization cluster assignments (see also Figure S1). (D) Interpretation of distinct cortical and ventral telencephalic lineages detected among germinal zone cells.
Figure 2. Major Sources of Transcriptional Heterogeneity Among Radial Glia
(A) Analysis of cell type identity of in silico sorted cortical lineage cells (schematic) – heatmap illustrates expression of identity genes across cells. Colored bars below heatmap highlight membership of cells into major groups (Figure S1). (B) Interpretation of sequential gene expression changes during cortical excitatory neuron differentiation (see also Figure S2). (C) Schematic illustrating in silico sorting of classically defined radial glia from the set of cortical lineage cells. Radial glia themselves display heterogeneity with respect to cell cycle progression, morphology, anatomical position and behavior, and PCA reveals major sources of transcriptional variation among radial glia. Histogram of PCA gene loading scores with gene ontology enrichments highlighted (adjusted p-value, Fisher exact test). (D) Interpretation of cell cycle phases for radial glia based on clustering according to sample scores along PC1, 2 and 4 (see also Figure S3). (E) Schematic of the anatomical sources of radial glia and violin plots illustrate prediction that VZ and adjacent inner SVZ contain a mixed population of vRG and oRG cells. (F) Histogram of VZ and OSVZ radial glia sample scores and gene loading scores along PC3. Radial glia from OSVZ (n=39) have significantly higher PC3 scores than radial glia from VZ (n=68) across 3 samples (p < 10-4, Welch t-test, see also Figure S3). Violin plots show distribution of expression values for strongly loading genes across cells from VZ and OSVZ sources. (G) Interpretation of oRG and vRG identity based on clustering cells according to top 1% of genes loading PC3. Schematic highlights the grouping of radial glia by inferred cell type rather than by anatomical source. Violin plots show distribution of expression values within inferred cell types.
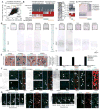
Figure 3. Candidate oRG Markers Relate to Position, Morphology, and Behavior of Cell Type
(A) Scatterplot highlighting specificity of genes to inferred radial glia subpopulations. Specificity is calculated by Pearson correlation with an idealized marker gene expressed only in candidate oRG cells (Y-axis) or candidate vRG cells (X-axis). Orange, green, and yellow boxes highlight genes with predicted specificity for oRG, vRG, and all radial glia cells (pan-RG) respectively (see also Figure S3). (B) Left heatmap showing expression of oRG, vRG, and pan-RG genes across inferred cell types and their average expression in microdissected cortical tissue samples (right heatmap) (Miller et al., 2014). (C) Similarity matrix of oRG and vRG specific gene expression levels across radial glia cells. (D) Representative examples of in situ hybridization staining for candidate vRG and oRG markers in human cortical tissue sections at GW18.2. Inset shows higher magnification of positively stained region (scale bar 25μm). (E) In situ hybridization combined with immunostaining for identity markers. Black arrows highlight cells expressing marker transcript and SOX2 but not EOMES (see also Figure S4 containing further examples). Bar chart shows quantification of molecular identity of OSVZ cells positive for oRG marker mRNA. Values represent mean ± s.e.m., n=3 biological replicates, GW16.7, GW18.2 and GW20. (F) Immunostaining of GW18 cortex for candidate oRG proteins and identity markers. White arrows highlight examples of immunopositive radial glia with staining in basal fiber. Yellow arrows indicate varicosities of the basal fiber of an oRG cell infected with adenovirus-GFP, with TNC immunostaining in the cell body. (G) Timelapse imaging of oRG cells undergoing MST and post-staining for HOPX, SOX2, and GFP. Yellow arrows highlight GFP-expressing cells. See also Figure S4.
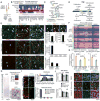
Figure 4. Pathways Enriched in oRG Cells Relate to Growth Factor Signaling and Maintenance of Proliferation
(A) Schema – oRG cells lack apical processes that transduce signals mediated by trophic factors in ventricular cerebrospinal fluid (CSF). (B) Heatmap of extracellular matrix gene expression across inferred cell types. Orange bar highlights genes with high oRG specificity across all cells and purple bar highlights genes differentially expressed by DESeq. (C) Functional protein association network generated using String-db (Szklarczyk et al., 2015). (D) Model of TNC protein, interaction partners and downstream pathways. (E) Immunolabeling of human OSVZ tissue sections reveals expression of ITGB5 by radial glia, including proliferating KI67+ and KI67-(top row, examples indicated with arrows) but not EOMES+ intermediate progenitors (yellow arrowheads denote PAX6+,EOMES+ intermediate progenitor cells, which do not express ITGB5, see also Figure S2). Top right panels show immunolabelling for ITGB5 and proliferation marker KI67 (white arrows indicate proliferating radial glia expressing ITGB5 and yellow arrow indicates non-actively proliferating radial glia expressing ITGB5). Bottom left rows show expression of TNC and PTPRZ1 in a subset of ITGB5+ radial glia (examples indicated with arrowheads). Bar charts represent quantification (mean ± s.e.m) across three biological replicates between GW16.5 and GW18. (F) Heatmap of oRG, vRG, pan-RG, and glioblasoma multiforme (GBM) stemness gene expression signatures across 598 cells from five primary GBM tumors (Patel et al., 2014). (G) Bar graphs show the oRG signature has the strongest correlation with the GBM stemness signature and with the pan-RG signature across GBM tumor samples. p-values report significance of difference between standardized correlation coefficients, error bars represent 95% confidence interval. (H) Heatmap showing average expression of selected genes across inferred cell types, and validation of LIFR expression in oRG cells by in situ hybridization (examples indicated by arrows). (I) Immunostaining of human tissue section for phosphorylated STAT3 (p-Y705) and SOX2 (see also Figure S5). Top bar graph represents quantification of nuclear immunostaining for phosphorylated STAT3 across germinal zone depth starting from ventricular edge (0.0) to the basal edge of the OSVZ (1.0). Bottom graph represents the molecular identity of STAT3+ Y705+ cells quantified in the OSVZ of three biological replicates between GW16.5 and GW18. Data represent mean ± s.e.m.. (J) Inhibition of STAT3 phosphorylation in organotypic OSVZ slice cultures reduces BrdU incorporation by radial glia. Images show representative examples of immunostained experimental sections. Bar graphs display quantification of BrdU incorporation by radial glia and intermediate progenitors in presence of STAT3 phosphorylation inhibitors or control DMSO (n=4, * - p<0.05, paired Student's t-test, error bars represent standard error of mean). Arrows indicate examples of cells expressing SOX2, but not EOMES or SATB2 that did not incorporate BrdU over 48 hour period in inhibitor treated slices.
Figure 5. Extensive Proliferative and Neurogenic Capacity of oRG Cells
(A) Schema representing progenitor cell competence of radial glia, oRG cells and glial progenitors (See also Figure S5). (B) In situ hybridization for genes expressed by oRG and other cell types but depleted in vRG cells and immunolabelling of GW18 human cortical sections (see also Figure S6). Black arrows indicate examples of mRNA expressing oRG cells. (C) Experimental design for single cell clonal lineage analysis of oRG cells labeled with retrovirus GFP (rvGFP). (D) Image and magnification of a well containing a single purified GFP-positive cell. Timelapse imaging of single cell with arrow highlighting MST preceding first division. (E) Images show movie frames capturing the initial division and a resulting clone after 7 days in culture of a cell exhibiting oRG specific mitotic somal translocation (left) and a cell undergoing an initial stationary division with fiber retraction characteristic of intermediate progenitors and a resulting clone after 7 days in culture (right). Chart shows clone sizes at 7 days for cells classified as oRGs and IPCs based on first division and morphology. (F) Immunostaining for neuronal or glial markers of 3 oRG cell clones after 50 days in vitro. Bar chart represents quantification of the average clone size of oRG cells. See also Figure S6.
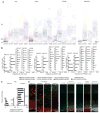
Figure 6. Molecular Signature of oRG Cells Emerges in VZ
(A) In situ hybridization for genes enriched in oRG cells across multiple developmental time points corresponding to human cortical neurogenesis. Sections were stained with antibodies against SOX2, EOMES and SATB2 to identify major cell populations (see also Figure S4 and S7). (B) The proportion of oRG marker cells that express all combinations of protein markers was quantified across 10 bins that span the germinal zone throughout neurogenesis. In all cases, oRG marker transcripts are almost exclusively expressed by SOX2+/EOMES–/SATB2– cells (black bars). Bar graphs highlight that at GW13.5 oRG markers predominantly label radial glia in the VZ, but by GW14.5 oRG markers predominantly label radial glia cells in the SVZ. (C) The proportion of SOX2+/EOMES–/SATB2– that expressed TNC was quantified across the span of the germinal zone at GW13.5 and GW18. (D) Immunolabelling of early developmental time points for oRG markers and SOX2. At GW13.5, TNC and PTPRZ1 protein show limited expression in radial glia close to the ventricular edge, while FAM107A protein is widely expressed in GW13.5 VZ. See also Figure S7.
Figure 7. Conservation of oRG Marker Gene Expression in Primates
(A) Bar graph indicates average differential percentile rank of pan-RG, oRG, and vRG genes for radial glia gene coexpression network specificity in human and mouse. Compared with pan-RG genes (n=29), human oRG genes (n=66) show reduced conservation with mouse radial glia signature (p < 0.05, Wilcoxon rank sum test). (B) Mouse E15.5 and E18.5 cortical sections immunoreacted for Tnc and Ptprz1 along with Sox2 and Eomes. Inset images show a magnified view of SVZ region and arrows highlight examples of Sox2–positive, Eomes–negative cells that co-label for Tnc or Ptprz1. LGE- lateral ganglionic eminence, Ctx-cortex. (C) Heatmaps show average expression level of oRG, vRG and pan-RG genes in distinct regions of developing macaque cortex. IVZ – inner VZ, OVZ – outer VZ; The NIH Blueprint Non-Human Primate (NHP) Atlas. In situ hybridization of macaque cortex showing expression of oRG marker genes mirrors human trajectory. (D) Radial glia in small rodent brains are concentrated along the ventricle and access cerebrospinal fluid trophic factors directly via apical processes. In contrast, large primate brains contain numerous radial glia in the OSVZ. Local production of growth factors by radial glia may provide additional trophic support to oRG cells in the OSVZ niche. (E) Increased expression of extracellular matrix proteins that potentiate growth factor signaling and activation of LIFR/STAT3 pathway may further maintain stemness in oRG cells. See also Figure S7.
Similar articles
- Pax6 mediates ß-catenin signaling for self-renewal and neurogenesis by neocortical radial glial stem cells.
Gan Q, Lee A, Suzuki R, Yamagami T, Stokes A, Nguyen BC, Pleasure D, Wang J, Chen HW, Zhou CJ. Gan Q, et al. Stem Cells. 2014 Jan;32(1):45-58. doi: 10.1002/stem.1561. Stem Cells. 2014. PMID: 24115331 Free PMC article. - Radial glia require PDGFD-PDGFRβ signalling in human but not mouse neocortex.
Lui JH, Nowakowski TJ, Pollen AA, Javaherian A, Kriegstein AR, Oldham MC. Lui JH, et al. Nature. 2014 Nov 13;515(7526):264-8. doi: 10.1038/nature13973. Nature. 2014. PMID: 25391964 Free PMC article. - Neurogenic radial glia in the outer subventricular zone of human neocortex.
Hansen DV, Lui JH, Parker PR, Kriegstein AR. Hansen DV, et al. Nature. 2010 Mar 25;464(7288):554-561. doi: 10.1038/nature08845. Nature. 2010. PMID: 20154730 - Neural progenitors, neurogenesis and the evolution of the neocortex.
Florio M, Huttner WB. Florio M, et al. Development. 2014 Jun;141(11):2182-94. doi: 10.1242/dev.090571. Development. 2014. PMID: 24866113 Review. - The extracellular matrix compartment of neural stem and glial progenitor cells.
Faissner A, Reinhard J. Faissner A, et al. Glia. 2015 Aug;63(8):1330-49. doi: 10.1002/glia.22839. Epub 2015 Apr 22. Glia. 2015. PMID: 25913849 Review.
Cited by
- Developmental excitation-inhibition imbalance underlying psychoses revealed by single-cell analyses of discordant twins-derived cerebral organoids.
Sawada T, Chater TE, Sasagawa Y, Yoshimura M, Fujimori-Tonou N, Tanaka K, Benjamin KJM, Paquola ACM, Erwin JA, Goda Y, Nikaido I, Kato T. Sawada T, et al. Mol Psychiatry. 2020 Nov;25(11):2695-2711. doi: 10.1038/s41380-020-0844-z. Epub 2020 Aug 7. Mol Psychiatry. 2020. PMID: 32764691 Free PMC article. - Human-Specific Genes, Cortical Progenitor Cells, and Microcephaly.
Heide M, Huttner WB. Heide M, et al. Cells. 2021 May 15;10(5):1209. doi: 10.3390/cells10051209. Cells. 2021. PMID: 34063381 Free PMC article. Review. - Human Cerebral Organoids and Fetal Brain Tissue Share Proteomic Similarities.
Nascimento JM, Saia-Cereda VM, Sartore RC, da Costa RM, Schitine CS, Freitas HR, Murgu M, de Melo Reis RA, Rehen SK, Martins-de-Souza D. Nascimento JM, et al. Front Cell Dev Biol. 2019 Nov 28;7:303. doi: 10.3389/fcell.2019.00303. eCollection 2019. Front Cell Dev Biol. 2019. PMID: 31850342 Free PMC article. - Multi-omics single-cell data integration and regulatory inference with graph-linked embedding.
Cao ZJ, Gao G. Cao ZJ, et al. Nat Biotechnol. 2022 Oct;40(10):1458-1466. doi: 10.1038/s41587-022-01284-4. Epub 2022 May 2. Nat Biotechnol. 2022. PMID: 35501393 Free PMC article. - BRN2 as a key gene drives the early primate telencephalon development.
Zhu X, Guo Y, Chu C, Liu D, Duan K, Yin Y, Si C, Kang Y, Yao J, Du X, Li J, Zhao S, Ai Z, Zhu Q, Ji W, Niu Y, Li T. Zhu X, et al. Sci Adv. 2022 Mar 4;8(9):eabl7263. doi: 10.1126/sciadv.abl7263. Epub 2022 Mar 4. Sci Adv. 2022. PMID: 35245119 Free PMC article.
References
- Bayatti N, Moss JA, Sun L, Ambrose P, Ward JF, Lindsay S, Clowry GJ. A molecular neuroanatomical study of the developing human neocortex from 8 to 17 postconceptional weeks revealing the early differentiation of the subplate and subventricular zone. Cerebral cortex. 2008;18:1536–1548. - PMC - PubMed
- Besser M, Jagatheaswaran M, Reinhard J, Schaffelke P, Faissner A. Tenascin C regulates proliferation and differentiation processes during embryonic retinogenesis and modulates the de-differentiation capacity of Muller glia by influencing growth factor responsiveness and the extracellular matrix compartment. Developmental biology. 2012;369:163–176. - PubMed
Publication types
MeSH terms
Substances
Grants and funding
- R01 NS075998/NS/NINDS NIH HHS/United States
- T32 GM007618/GM/NIGMS NIH HHS/United States
- U01 MH105989/MH/NIMH NIH HHS/United States
- UL1 TR000004/TR/NCATS NIH HHS/United States
LinkOut - more resources
Full Text Sources
Other Literature Sources
Molecular Biology Databases
Research Materials
Miscellaneous


