Interindividual methylomic variation across blood, cortex, and cerebellum: implications for epigenetic studies of neurological and neuropsychiatric phenotypes - PubMed (original) (raw)
Interindividual methylomic variation across blood, cortex, and cerebellum: implications for epigenetic studies of neurological and neuropsychiatric phenotypes
Eilis Hannon et al. Epigenetics. 2015.
Abstract
Given the tissue-specific nature of epigenetic processes, the assessment of disease-relevant tissue is an important consideration for epigenome-wide association studies (EWAS). Little is known about whether easily accessible tissues, such as whole blood, can be used to address questions about interindividual epigenomic variation in inaccessible tissues, such as the brain. We quantified DNA methylation in matched DNA samples isolated from whole blood and 4 brain regions (prefrontal cortex, entorhinal cortex, superior temporal gyrus, and cerebellum) from 122 individuals. We explored co-variation between tissues and the extent to which methylomic variation in blood is predictive of interindividual variation identified in the brain. For the majority of DNA methylation sites, interindividual variation in whole blood is not a strong predictor of interindividual variation in the brain, although the relationship with cortical regions is stronger than with the cerebellum. Variation at a subset of probes is strongly correlated across tissues, even in instances when the actual level of DNA methylation is significantly different between them. A substantial proportion of this co-variation, however, is likely to result from genetic influences. Our data suggest that for the majority of the genome, a blood-based EWAS for disorders where brain is presumed to be the primary tissue of interest will give limited information relating to underlying pathological processes. These results do not, however, discount the utility of using a blood-based EWAS to identify biomarkers of disease phenotypes manifest in the brain. We have generated a searchable database for the interpretation of data from blood-based EWAS analyses ( http://epigenetics.essex.ac.uk/bloodbrain/).
Keywords: DNA methylation; Illumina 450K array; blood; brain; cerebellum; cortex; epigenetic epidemiology.
Figures
Figure 1.
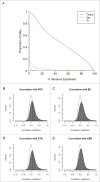
Variation in DNA methylation in whole blood is correlated with variation in the brain for a small proportion of probes. (A) The proportion of sites (y-axis) for which tissue (black), sex (red), or individual (green) explain a given percentage of DNA methylation variance (x-axis). (B) to (E) Histograms showing the distribution of correlation coefficients between DNA methylation in whole blood and the 4 brain regions (PFC, EC, STG and CER). For all 4 brain regions the distribution of correlation coefficients is significantly skewed to the right, with stronger correlations seen between whole blood and cortical regions than between whole blood and cerebellum.
Figure 2.
Variation in DNA methylation in whole blood as a predictor of variation in the brain. Shown is the proportion of sites (y-axis) for which variation in blood explains a certain of percentage of DNA methylation variance (x-axis) in the PFC (black), EC (red), STG (green), and CER (blue) from the same individuals.
Figure 3.
DNA methylation in whole blood significantly co-varies with that in the brain at some genomic loci. An example output of our online database (
http://epigenetics.essex.ac.uk/bloodbrain/
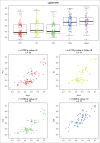
) for blood-brain correla-tions at cg26039926. Shown is a boxplot of the distribution of DNA methylation values across all individuals split by tissue and four scatterplots demonstrating the relationship between DNA methylation in whole blood and four brain regions (PFC, EC, STG, CER). At this probe there is a highly significant correlation between individual variation in whole blood and that observed in all four brain regions.
Figure 4.
Sites at which interindividual variation correlates between whole blood and brain are enriched in specific genic features. Bar charts plotting the percentage of sites annotated to particular genic feature categories and CpG Island annotations for the full set of “blood variable” sites, in addition to the subset of sites characterized by the highest correlation (r2 > 50%) between blood and brain. Fisher's exact tests were used to test for either over or underrepresentation for each type of feature and are presented in Table S2.
Figure 5.
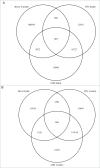
EWAS analyses of brain phenotypes using whole blood DNA may potentially miss disease associated variation and interrogate DNA methylation sites that are not actually variable in the brain. Venn diagrams showing the overlap of DNA methylation sites that are (A) variable in whole blood but not variable in the cortex (STG) or cerebellum and (B) variable in the cortex (STG) and cerebellum but not in whole blood.
Similar articles
- A meta-analysis of epigenome-wide association studies in Alzheimer's disease highlights novel differentially methylated loci across cortex.
Smith RG, Pishva E, Shireby G, Smith AR, Roubroeks JAY, Hannon E, Wheildon G, Mastroeni D, Gasparoni G, Riemenschneider M, Giese A, Sharp AJ, Schalkwyk L, Haroutunian V, Viechtbauer W, van den Hove DLA, Weedon M, Brokaw D, Francis PT, Thomas AJ, Love S, Morgan K, Walter J, Coleman PD, Bennett DA, De Jager PL, Mill J, Lunnon K. Smith RG, et al. Nat Commun. 2021 Jun 10;12(1):3517. doi: 10.1038/s41467-021-23243-4. Nat Commun. 2021. PMID: 34112773 Free PMC article. - Genome-wide DNA methylation profiling identifies convergent molecular signatures associated with idiopathic and syndromic autism in post-mortem human brain tissue.
Wong CCY, Smith RG, Hannon E, Ramaswami G, Parikshak NN, Assary E, Troakes C, Poschmann J, Schalkwyk LC, Sun W, Prabhakar S, Geschwind DH, Mill J. Wong CCY, et al. Hum Mol Genet. 2019 Jul 1;28(13):2201-2211. doi: 10.1093/hmg/ddz052. Hum Mol Genet. 2019. PMID: 31220268 Free PMC article. - Case-control meta-analysis of blood DNA methylation and autism spectrum disorder.
Andrews SV, Sheppard B, Windham GC, Schieve LA, Schendel DE, Croen LA, Chopra P, Alisch RS, Newschaffer CJ, Warren ST, Feinberg AP, Fallin MD, Ladd-Acosta C. Andrews SV, et al. Mol Autism. 2018 Jun 28;9:40. doi: 10.1186/s13229-018-0224-6. eCollection 2018. Mol Autism. 2018. PMID: 29988321 Free PMC article. - Using epigenome-wide association scans of DNA methylation in age-related complex human traits.
Tsai PC, Spector TD, Bell JT. Tsai PC, et al. Epigenomics. 2012 Oct;4(5):511-26. doi: 10.2217/epi.12.45. Epigenomics. 2012. PMID: 23130833 Review. - Cell-type deconvolution in epigenome-wide association studies: a review and recommendations.
Teschendorff AE, Zheng SC. Teschendorff AE, et al. Epigenomics. 2017 May;9(5):757-768. doi: 10.2217/epi-2016-0153. Epub 2017 Mar 14. Epigenomics. 2017. PMID: 28517979 Review.
Cited by
- Preliminary assessment of pre-morbid DNA methylation in individuals at high genetic risk of mood disorders.
Walker RM, Sussmann JE, Whalley HC, Ryan NM, Porteous DJ, McIntosh AM, Evans KL. Walker RM, et al. Bipolar Disord. 2016 Aug;18(5):410-22. doi: 10.1111/bdi.12415. Epub 2016 Jul 21. Bipolar Disord. 2016. PMID: 27440233 Free PMC article. - Assessing the co-variability of DNA methylation across peripheral cells and tissues: Implications for the interpretation of findings in epigenetic epidemiology.
Hannon E, Mansell G, Walker E, Nabais MF, Burrage J, Kepa A, Best-Lane J, Rose A, Heck S, Moffitt TE, Caspi A, Arseneault L, Mill J. Hannon E, et al. PLoS Genet. 2021 Mar 19;17(3):e1009443. doi: 10.1371/journal.pgen.1009443. eCollection 2021 Mar. PLoS Genet. 2021. PMID: 33739972 Free PMC article. - Sleep and Methylation of Estrogen Receptor Genes, ESR1 and GPER, in Healthy Middle-Aged and Older Women: Findings from the Women 40+ Healthy Aging Study.
Gardini ES, Fiacco S, Mernone L, Ehlert U. Gardini ES, et al. Nat Sci Sleep. 2020 Jul 27;12:525-536. doi: 10.2147/NSS.S256102. eCollection 2020. Nat Sci Sleep. 2020. PMID: 32801978 Free PMC article. - Epigenetics applied to child and adolescent mental health: Progress, challenges and opportunities.
Cecil CAM, Neumann A, Walton E. Cecil CAM, et al. JCPP Adv. 2022 Dec 23;3(1):e12133. doi: 10.1002/jcv2.12133. eCollection 2023 Mar. JCPP Adv. 2022. PMID: 36910008 Free PMC article. - Epigenetic Age Acceleration and Cognitive Function in African American Adults in Midlife: The Atherosclerosis Risk in Communities Study.
Bressler J, Marioni RE, Walker RM, Xia R, Gottesman RF, Windham BG, Grove ML, Guan W, Pankow JS, Evans KL, Mcintosh AM, Deary IJ, Mosley TH, Boerwinkle E, Fornage M. Bressler J, et al. J Gerontol A Biol Sci Med Sci. 2020 Feb 14;75(3):473-480. doi: 10.1093/gerona/glz245. J Gerontol A Biol Sci Med Sci. 2020. PMID: 31630168 Free PMC article.
References
- Murphy TM, Mill J. Epigenetics in health and disease: heralding the EWAS era. Lancet 2014; 383:1952-4; PMID:24630775; http://dx.doi.org/10.1016/S0140-6736(14)60269-5 - DOI - PubMed
- Heyn H, Carmona FJ, Gomez A, Ferreira HJ, Bell JT, Sayols S, Ward K, Stefansson OA, Moran S, Sandoval J, et al.. DNA methylation profiling in breast cancer discordant identical twins identifies DOK7 as novel epigenetic biomarker. Carcinogenesis 2013; 34:102-8; PMID:23054610; http://dx.doi.org/10.1093/carcin/bgs321 - DOI - PMC - PubMed
- Irizarry RA, Ladd-Acosta C, Wen B, Wu Z, Montano C, Onyango P, Cui H, Gabo K, Rongione M, Webster M, et al.. The human colon cancer methylome shows similar hypo- and hypermethylation at conserved tissue-specific CpG island shores. Nat Genet 2009; 41:178-86; PMID:19151715; http://dx.doi.org/10.1038/ng.298 - DOI - PMC - PubMed
- Lange CP, Campan M, Hinoue T, Schmitz RF, van der Meulen-de Jong AE, Slingerland H, van der Meulen-de Jong AE, Slingerland H, Kok PJ, van Dijk CM, et al.. Genome-scale discovery of DNA-methylation biomarkers for blood-based detection of colorectal cancer. PLoS One 2012; 7:e50266; PMID:23209692; http://dx.doi.org/10.1371/journal.pone.0050266 - DOI - PMC - PubMed
- Liu Y, Aryee MJ, Padyukov L, Fallin MD, Hesselberg E, Runarsson A, Reinius L, Acevedo N, Taub M, Ronninger M, et al.. Epigenome-wide association data implicate DNA methylation as an intermediary of genetic risk in rheumatoid arthritis. Nat Biotechnol 2013; 31:142-7; PMID:23334450; http://dx.doi.org/10.1038/nbt.2487 - DOI - PMC - PubMed
Publication types
MeSH terms
Substances
LinkOut - more resources
Full Text Sources
Other Literature Sources
Molecular Biology Databases


