Harnessing the landscape of microbial culture media to predict new organism-media pairings - PubMed (original) (raw)
Harnessing the landscape of microbial culture media to predict new organism-media pairings
Matthew A Oberhardt et al. Nat Commun. 2015.
Abstract
Culturing microorganisms is a critical step in understanding and utilizing microbial life. Here we map the landscape of existing culture media by extracting natural-language media recipes into a Known Media Database (KOMODO), which includes >18,000 strain-media combinations, >3300 media variants and compound concentrations (the entire collection of the Leibniz Institute DSMZ repository). Using KOMODO, we show that although media are usually tuned for individual strains using biologically common salts, trace metals and vitamins/cofactors are the most differentiating components between defined media of strains within a genus. We leverage KOMODO to predict new organism-media pairings using a transitivity property (74% growth in new in vitro experiments) and a phylogeny-based collaborative filtering tool (83% growth in new in vitro experiments and stronger growth on predicted well-scored versus poorly scored media). These resources are integrated into a web-based platform that predicts media given an organism's 16S rDNA sequence, facilitating future cultivation efforts.
Figures
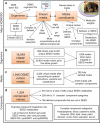
Figure 1. Schematic of KOMODO, the Known Media Database.
The contents of KOMODO are shown. (a) A map of the structure of the database, showing how major tables and information points connect. (b–d) Numbers of organisms, media and nutritional components present in the database. SEED refers to the Model SEED database; see KOMODO website and Methods for more details.
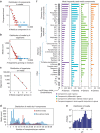
Figure 2. Large-scale properties of known media.
(a) Distributions of components in media. This includes both defined and complex/undefined components, where undefined components are grouped into their complex categories and each category present in a medium is counted as one component. (b) Distributions of media by the number of organisms that grow on them. (c) Distributions of the number of media that organisms grow on. (d) Distribution of media by the number of components within them. (e) Distribution of pH values of known media. Red squares in a and b denote the bins used for the power law fit. (f) The 40 most frequently used media components across genera. Ions listed here were typically added to media as salts, which we assume completely dissociate in solution (for example, MgCl2 becomes Mg2+ and Cl−). Components are broken into four groups: biologically common ions/compounds, trace metals/metalloids, vitamins/coenzymes and other. Within each group, components are listed in order of their frequency of usage across genera, from most to least. Left of the bar graphs is a list of average concentrations of each component in media across KOMODO, listed in units of log10(molar concentration). A component is ‘differential' in a genus if it appears in media for some strains in that genus but not others.
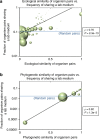
Figure 3. Media usage is correlated with ecological and phylogenetic similarity.
The (a) ecological and (b) phylogenetic distances between pairs of species are plotted versus the fraction of species pairs within each ecological or phylogenetic distance bin that share at least one DSMZ medium. Bubble areas are scaled to the number of organism pairs in each bin. The fraction of random organism pairs of any ecological/phylogenetic distance sharing a lab medium is shown by the horizontal blue line, for reference. Distances are determined by a Jaccard metric of ecological co-growth in Greengenes database (ecological) or by subtree distance (phylogenetic; Methods).
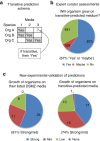
Figure 4. Transitive media predictions.
Organism–media pairings are predicted based on an observed transitivity heuristic following a schema shown in (a). Organisms orgA and orgB share a medium (M1), organisms orgB and orgC grow on M2 and the third organism orgC grows on medium 3; we then predict, based on transitivity, that orgA will grow on medium 3. (b) Distribution of expert DSMZ curator opinions on whether organisms will grow in transitive-predicted media (full opinion descriptions are provided in Supplementary Data 1). (c) Pie charts that represent the number of growth phenotypes observed for organisms grown in vitro on their listed lab media (left) and for the same organisms grown on newly predicted media (right). Numbers in the pie charts show the number of organism–medium pairs tested.
Figure 5. Collaborative filtering predicts media usage.
(a) The concept of collaborative filtering. In brief, the media preferences for a new organism (org3) are predicted based on known preferences of phylogenetically similar organisms (here, org2). (b) Circles represent bins per collaborative score, with diameters proportional to the number of organism–media pairs per bin. Collaborative scores correlate with the true positive fraction (that is, the number of organism–media pairings known in the actual DSMZ database). (c) The partial correlation of collaborative (=collab) score versus true positive fraction, corrected for media usage frequency. (d) The true positive percentages of collaborative filtering predictions from GROWREC are presented with the base predictor, and with oxygen and/or salt filters added on. The x axis shows the % of organism–media pair predictions considered (starting from the one with the highest collaborative score and taking predictions in descending order of collaborative score), and the y axis shows the percentage of predicted organism–media pairs within a given set that are known true positives (that is, are already listed in KOMODO).
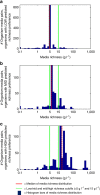
Figure 6. Predicted richness preferences of organisms reflect richness of confirmed growth media.
Organisms are split into three groups based on their predicted richness preferences: (a) low, (b) medium and (c) high. We then plot histograms of the ‘richness' of media paired in the DSMZ repository with organisms within each group. The red vertical line in each plot denotes the median of the distribution, and the green lines denote cutoffs of low/medium and medium/high richness (5 and 15 g l−1, respectively).
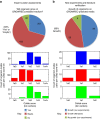
Figure 7. Curator assessments and experimental validation of GROWREC predictions.
(a) Expert curator opinions on the goodness of GROWREC predictions. (b) Results from our in vitro growth experiments or found in literature verifying top GROWREC predictions. Histograms in a and b represent the distributions of collab scores for the org-medium pairs assessed, and are coloured the same way as the pie charts. Numbers in the pie charts denote how many org-medium pairs were tested for growth.
Figure 8. Growth of organisms on ‘good' versus ‘bad' media as predicted by GROWREC:
A set of 40 ‘good' and 40 ‘bad' organism–media pairings were chosen by GROWREC, using the same 36 species and 13 media for both sets (but swapping which organisms paired with which media; 4 pairs were removed because of contamination). All organisms are aerobic heterotrophs with low salt requirements. (a) ‘Good' organism–media pairs showed significantly better growth than ‘bad' pairs (_P_=1.6e−3 in ranksum test). (b) Growth was also better on ‘good' versus ‘bad' media on an organism-by-organism basis (_P_=2.5e−3 in paired signrank test for each organism growing better on its ‘good' versus its ‘bad' media). Each circle in the plot represents a single organism, with its average growth on ‘good' media on the y axis, and its average growth on ‘bad' media on the x axis (dots are jittered for visibility). Organisms are coloured based on whether they grow better on their ‘good' versus their ‘bad' media (see legend).
Similar articles
- MediaDive: the expert-curated cultivation media database.
Koblitz J, Halama P, Spring S, Thiel V, Baschien C, Hahnke RL, Pester M, Overmann J, Reimer LC. Koblitz J, et al. Nucleic Acids Res. 2023 Jan 6;51(D1):D1531-D1538. doi: 10.1093/nar/gkac803. Nucleic Acids Res. 2023. PMID: 36134710 Free PMC article. - Isolation of sulfate-reducing bacteria from the terrestrial deep subsurface and description of Desulfovibrio cavernae sp. nov.
Sass H, Cypionka H. Sass H, et al. Syst Appl Microbiol. 2004 Sep;27(5):541-8. doi: 10.1078/0723202041748181. Syst Appl Microbiol. 2004. PMID: 15490555 - [Approaches for increasing the culturability of microorganisms].
Guo B, Wu XL, Qian Y. Guo B, et al. Wei Sheng Wu Xue Bao. 2006 Jun;46(3):504-7. Wei Sheng Wu Xue Bao. 2006. PMID: 16933632 Review. Chinese. - [Comparative study with 2 new and 8 known nutrient media for cultivation of fastidious and nonfastidious microbial agents from cerebrospinal fluid and other body fluids].
Abdou MA, Stöckel H. Abdou MA, et al. Zentralbl Bakteriol Mikrobiol Hyg A Med Mikrobiol Infekt Parasitol. 1982 May;252(1):116-28. Zentralbl Bakteriol Mikrobiol Hyg A Med Mikrobiol Infekt Parasitol. 1982. PMID: 6981897 German. - Tapping into microbial diversity.
Keller M, Zengler K. Keller M, et al. Nat Rev Microbiol. 2004 Feb;2(2):141-50. doi: 10.1038/nrmicro819. Nat Rev Microbiol. 2004. PMID: 15040261 Review.
Cited by
- Diversity and plant growth promoting ability of rice root-associated bacteria in Burkina-Faso and cross-comparison with metabarcoding data.
Sondo M, Wonni I, Koïta K, Rimbault I, Barro M, Tollenaere C, Moulin L, Klonowska A. Sondo M, et al. PLoS One. 2023 Nov 30;18(11):e0287084. doi: 10.1371/journal.pone.0287084. eCollection 2023. PLoS One. 2023. PMID: 38032916 Free PMC article. - Agricultural Pest Management: The Role of Microorganisms in Biopesticides and Soil Bioremediation.
Vermelho AB, Moreira JV, Akamine IT, Cardoso VS, Mansoldo FRP. Vermelho AB, et al. Plants (Basel). 2024 Oct 1;13(19):2762. doi: 10.3390/plants13192762. Plants (Basel). 2024. PMID: 39409632 Free PMC article. Review. - Plant Materials are Sustainable Substrates Supporting New Technologies of Plant-Only-Based Culture Media for in vitro Culturing of the Plant Microbiota.
Mourad EF, Sarhan MS, Daanaa HA, Abdou M, Morsi AT, Abdelfadeel MR, Elsawey H, Nemr R, El-Tahan M, Hamza MA, Abbas M, Youssef HH, Abdelhadi AA, Amer WM, Fayez M, Ruppel S, Hegazi NA. Mourad EF, et al. Microbes Environ. 2018 Mar 29;33(1):40-49. doi: 10.1264/jsme2.ME17135. Epub 2018 Mar 23. Microbes Environ. 2018. PMID: 29479006 Free PMC article. - Optimized Cultivation and Syntrophic Relationship of Anaerobic Benzene-Degrading Enrichment Cultures under Methanogenic Conditions.
Phan HV, Kurisu F, Kiba K, Furumai H. Phan HV, et al. Microbes Environ. 2021;36(3):ME21028. doi: 10.1264/jsme2.ME21028. Microbes Environ. 2021. PMID: 34433738 Free PMC article. - Global metabolic interaction network of the human gut microbiota for context-specific community-scale analysis.
Sung J, Kim S, Cabatbat JJT, Jang S, Jin YS, Jung GY, Chia N, Kim PJ. Sung J, et al. Nat Commun. 2017 Jun 6;8:15393. doi: 10.1038/ncomms15393. Nat Commun. 2017. PMID: 28585563 Free PMC article.
References
- Letort C. & Juillard V. Development of a minimal chemically-defined medium for the exponential growth of Streptococcus thermophilus. J. Appl. Microbiol. 91, 1023–1029 (2001). - PubMed
- Kim K. W. & Lee S. B. Growth of the hyperthermophilic marine archaeon Aeropyrum pernix in a defined medium. J. Biosci. Bioeng. 95, 618–622 (2003). - PubMed
Publication types
MeSH terms
Substances
LinkOut - more resources
Full Text Sources
Other Literature Sources
