Expression of Cationic Amino Acid Transporter 2 Is Required for Myeloid-Derived Suppressor Cell-Mediated Control of T Cell Immunity - PubMed (original) (raw)
Expression of Cationic Amino Acid Transporter 2 Is Required for Myeloid-Derived Suppressor Cell-Mediated Control of T Cell Immunity
Cansu Cimen Bozkus et al. J Immunol. 2015.
Abstract
Myeloid-derived suppressor cells (MDSCs) are a heterogeneous population of immature cells that expand during benign and cancer-associated inflammation and are characterized by their ability to inhibit T cell immunity. Increased metabolism of l-Arginine (l-Arg), through the enzymes arginase 1 and NO synthase 2 (NOS2), is well documented as a major MDSC suppressive mechanism. Therefore, we hypothesized that restricting MDSC uptake of l-Arg is a critical control point to modulate their suppressor activity. Using murine models of prostate-specific inflammation and cancer, we have identified the mechanisms by which extracellular l-Arg is transported into MDSCs. We have shown that MDSCs recruited to localized inflammation and tumor sites upregulate cationic amino acid transporter 2 (Cat2), coordinately with Arg1 and Nos2. Cat2 expression is not induced in MDSCs in peripheral organs. CAT2 contributes to the transport of l-Arg in MDSCs and is an important regulator of MDSC suppressive function. MDSCs that lack CAT2 have significantly reduced suppressive ability ex vivo and display impaired capacity for regulating T cell responses in vivo as evidenced by increased T cell expansion and decreased tumor growth in Cat2(-/-) mice. The abrogation of suppressive function is due to low intracellular l-Arg levels, which leads to the impaired ability of NOS2 to catalyze l-Arg-dependent metabolic processes. Together, these findings demonstrate that CAT2 modulates MDSC function. In the absence of CAT2, MDSCs display diminished capacity for controlling T cell immunity in prostate inflammation and cancer models, where the loss of CAT2 results in enhanced antitumor activity.
Copyright © 2015 by The American Association of Immunologists, Inc.
Figures
Figure 1
Cat2 is coordinately induced with Arg1 and Nos2 in MDSC. CD11b+Gr-1+ cells were isolated from bone marrow of naïve wild type mice and cultured with or without GM-CSF, IL-13 and IFN- γ. mRNA was isolated after 3 days of culture (A) or every 24 hour during culture (n=4 mice, *** p=0.0005, ** p=0.0027, * p=0.0211, *** p=0.0009) (B). Arg1, Nos2 and Cat2 gene expression were analyzed by qPCR. Data are representative of at least 3 independent experiments. For all experiments errors bars indicate ±SEM.
Figure 2
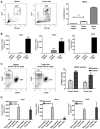
Cat2 is induced in functionally active MDSC. CD11b+Gr-1+ and CD11b+Ly6ChighLy6G- (M-MDSC), CD11b+Ly6ClowLy6G+ (G-MDSC) cells were isolated by FACS from ascites and spleen of RM1 i.p. tumor bearing Cat2+/+ (WT) mice 6 days after tumor implantation or from the spleens of naïve mice. The percentage of CD11b+Gr-1+ cells were demonstrated under SSC/FSC gate (n=4, *** p=0.0002) (A). Percentages of CD11b+Ly6ChighLy6G- (M-MDSC) and CD11b+Ly6ClowLy6G+ (G-MDSC) were demonstrated under CD11b+ gate. Data are pooled from 6 independent experiments (C). mRNA was freshly isolated and analyzed by qPCR for Arg1, Nos2 and Cat2 expression (B and D). Data are representative of at least 3 independent experiments. For all experiments errors bars indicate ±SEM.
Figure 3
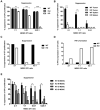
MDSC suppressive capacity is reduced in the absence of CAT2. CD11b+Gr-1+ cells were isolated from bone marrow of naïve mice and cultured with GM-CSF, IL-13 and IFN- γ. After 3 days cells were harvested and co-cultured with naïve OTI in the presence of SIINFEKL at indicated ratios for another 3 days. BrdU was added 6 hours before harvest. OTI proliferation was evaluated by measuring BrdU incorporation. Data are representative of 3 independent experiments (n=3-4/group, ** p=0.0057, *** p=0.0001, **** p<0.0001) (A). CD11b+Gr-1+ cells were isolated from tumor site and spleens of RM1 bearing WT and KO mice (n=3-5/group, pooled) 6 days after tumor implantation and co-cultured with preactivated OTIs for 18 hours. BrdU was added 6 hours before harvest. OTI proliferation was evaluated by measuring BrdU incorporation. Data are pooled from 5 and 3 independent experiments for tumor and for spleen, respectively (*** p=0.0002, **** p<0.0001) (B). CD11b+Gr-1+ cells from the ascites of RM1 i.p. tumor bearing Cat2+/+ (WT) and Cat2-/- (KO) mice (n=5/group, pooled) were co-cultured with naive OTI cells with SIINFEKL for 48 hours. BrdU and protein transport inhibitor were added 6 hours before harvest. OTI proliferation was evaluated by measuring BrdU incorporation (C) IFN-γ levels in OT-I cells were determined by flow cytometry for intracellular IFN-γ staining (D). Data are representative of 5 independent experiments. M-MDSC and G-MDSC were isolated by FACS from the ascites of RM1 i.p. tumor bearing WT and KO mice (n=3-5/group, pooled) 6 days after tumor implantation (E) and co-cultured with naive OTI cells with SIINFEKL for 48-72 hours. BrdU was added 6 hours before harvest. OTI proliferation was evaluated by measuring BrdU incorporation. Data are pooled from 5 independent experiments (* p=0.0312 at 0.5:1 and 0.0139 at 0.25:1) (F). For all experiments errors bars indicate ±SEM.
Figure 4
CAT2 mediates L-Arginine transportation in MDSC. Thioglycollate elicited peritoneal macrophages from Cat2+/+ (WT) and Cat2-/- (KO) mice (n=5/group) were activated with LPS and IFN-γ for 18h. L-Arginine transport was measured by using 6μCi/ml L-3[H]-Arg in Na+ containing buffer. For _N-_ethyl maleimide (NEM), cells were pretreated with 5 mM NEM for 5 min and washed with transport buffer before measuring uptake. Data are representative of 3 independent experiments. (**** p<0.0001) (A). CD11b+Gr-1+ cells were isolated from ascites of RM1 tumor bearing WT and KO mice and cultured over night with GM-CSF, IL-13 and IFN- γ. Total L-Arginine transport was measured by using 6μCi/ml L-3[H]-Arg in Na+ containing buffer. Data are pooled from 3 independent experiments. (n=13/group, * p=0.0184) (B) Data correspond to reduction of total L-3[H]-Arg transport when y+ system was blocked using 5 mM NEM in WT and KO MDSC. Data are pooled from 3 independent experiments (n=10/group, ** p=0.0016) (C). Data correspond to reduction of total L-3[H]-Arg transport when y+L system was blocked due to the presence of 5 mM L-Leu in transport media. Data are pooled from 4 independent experiments (n=13/group) (D). All error bars indicate ±SEM.
Figure 5
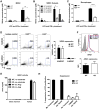
Cat2-/- MDSC have reduced NO production. CD11b+Gr-1+ MDSC (A) and CD11b+LyChighLy6G- (M-MDSC) and CD11b+LyClowLy6G+ (G-MDSC) subsets (B) were isolated from tumor site of RM1 bearing Cat2+/+ (WT) and Cat2-/- (KO) mice. Cells were cultured in the presence and absence of LPS and IFN-γ for 24 hours. Nitrite formation upon stimulation with LPS and IFN-γ was measured in a Griess Assay. Data are pooled from 2 independent experiments (n=5-9 mice/group for MDSC. ** p=0.0065, n=4/group, pooled for subsets. * p=0.0426). Thioglycollate elicited peritoneal macrophages from Cat2+/+ (WT) and Cat2-/- (KO) mice (n=4/group) were activated with LPS and IFN-γ for 18h. Nitrite formation was measured in a Griess Assay. Data are representative of at least 2 independent experiments (**** p<0.0001) (C). Cells from the ascites of WT and KO RM1 mice were cultured with LPS and IFN-γ overnight prior to intracellular staining of NOS2 for flow cytometry. Percentages of NOS2+ cells were demonstrated under CD11b+LyChighLy6G- (M-MDSC) and CD11b+LyClowLy6G+ (G-MDSC) gates (n=4-5/group). Data are representative of 3 independently performed experiments (D). Quantichrome Urea Assay Kit that measures urea and citrulline was utilized to measure arginase activity in CD11b+Gr-1+ cells freshly isolated from the bone marrow and ascites of WT and KO RM1 mice (n=4/group) with or without supplementing L-Arg. Data are representative of 3 independent experiments (E). Cells freshly isolated from the ascites of WT and KO RM1 mice were stained with anti-ARG1 antibody. ARG1 expression was detected by flow cytometry. Mean fluorescent intensity (MFI) of ARG1 expression was reported under CD11b+Gr-1+ gate (n=4/group). Data are representative of 3 independently performed experiments (F). WT and KO MDSC were used in a 48-hour suppression assay at 2:1 (MDSC:OTI) ratio in the presence or absence of NOS inhibitor, LNMMA (0.5 mM), ARG inhibitor, nor-NOHA (0.5 mM). BrdU was added 6 hours before harvest. OTI proliferation was evaluated by measuring BrdU incorporation. Data were pooled from 2 independent experiments (H). For all experiments errors bars indicate ±SEM.
Figure 6
Cat2-/- MDSC have increased ROS formation. Cells from ascites of i.p. RM1 bearing WT and KO mice were analyzed for ROS levels. DCFDA signal was analyzed under the gates for CD11b+Gr-1+ (n=4/group)(A) and CD11b+LyChighLy6G- (M-MDSC) and CD11b+LyClowLy6G+ (G-MDSC) subsets (n=8/group, data are pooled from 2 independent experiments) (B). Signal intensity was represented as MFI. CD11b+Gr-1+ cells were isolated by FACS from the ascites of RM1 i.p. tumor bearing Cat2+/+ (WT) and Cat2-/- (KO) mice (n=5/group, pooled)6 days after tumor implantation and suppression assay was performed at 2:1 (MDSC:OTI) ratio in the presence of differing concentrations of ROS inhibitor, NAC (C). WT MDSC were used for suppression assay at indicated MDSC:OTI ratios with or without 10 mM NAC (D). Data are representative of at least 2 independent experiments. All suppression assays were performed by co-culturing MDSC with preactivated OTI cells for 48 hours. BrdU was added 6 hours before harvest. OTI proliferation was evaluated by measuring BrdU incorporation. For all experiments errors bars indicate ±SEM.
Figure 7
CAT2-/- MDSC display diminished capacity for controlling T-cell immunity in vivo. Cat2-/- mice were injected intradermally with 3× 10⁶ EG7 lymphoma cells alone, 3× 10⁶ EG7 with 104 activated OTIs, 3× 10⁶ EG7 with 104 activated OTIs and 104 Cat2+/+ or Cat2-/- CD11b+Gr-1+ cells. Data are pooled from 2 independent experiments (n=5-6 mice/group). p values for the comparison of WT or KO MDSC received groups are 0.0001, 0.0003 and 0.0033 on Day 5, 8 and 11, respectively (A). Cat2+/+ and Cat2-/- mice were injected intradermally with 3× 10⁶ EG7 lymphoma cells. 7 days after tumor inoculation, mice were intravenously injected with 106 activated OTI cells (n=6/group). Tumor growth was monitored. p values for the comparison of WT and KO mice that received OTI are 0.0072 and 0.0449 on Day 10 and 13, respectively. Tumor size was calculated as (W2× L) /2 [mm3]. Errors bars indicate ±SEM.
Figure 8
CAT2 modulates MDSC regulatory functions in an acute prostate inflammation model.
P
rostate
O
valbumin
E
xpressing
T
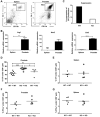
ransgenic (POET-3) mice (n=3) were injected with 5× 10⁶ activated OTI cells to induce prostate inflammation. 5 days later spleen and prostate CD11b+Gr-1+ cells (under CD45+ gate) (A) were sorted by FACS. mRNA was freshly isolated from sorted cells and analyzed by qPCR for Arg1, Nos2 and Cat2 expression (B). Data are representative of at least 3 independent experiments (** p=0.038, **** p<0.0001). MDSC were isolated from inflamed prostates of Cat2+/+ and Cat2-/- POET-3 mice. (n=3/group, pooled) and co-cultured with preactivated OTI cells for 48 hours. BrdU was added 6 hours before harvest. OTI proliferation was evaluated by measuring BrdU incorporation (C). 5× 10⁶ activated OTI cells were intravenously injected into POET-3 mice to induce inflammation. 2 days later, mice were adoptively transferred (i.p.) with 4× 10⁶ Cat2+/+ and Cat2-/- bone marrow cells that were cultured 5 days with GM-CSF and IL-6.Cat2+/+ POET-3 received Cat2+/+ cells and Cat2-/- POET-3 received Cat2-/- or Cat2+/+ cells. Percentage of Thy1.1+ (OTI) cells in 5-day inflamed POET-3 prostate (D) and spleen (E) are represented under CD45+CD8+ gate. Each individual datum point represents a single mouse (***p<0.001, *p<0.05). Prostate (F) and spleen (G) cells were cultured with SIINFEKL and protein transport inhibitor for 8 hours and IFN-γ was detected by intracellular staining for flow cytometry. Data are representative for at least 2 independent experiments. Errors bars indicate ±SEM.
Similar articles
- Deletion of cationic amino acid transporter 2 exacerbates dextran sulfate sodium colitis and leads to an IL-17-predominant T cell response.
Singh K, Coburn LA, Barry DP, Asim M, Scull BP, Allaman MM, Lewis ND, Washington MK, Rosen MJ, Williams CS, Chaturvedi R, Wilson KT. Singh K, et al. Am J Physiol Gastrointest Liver Physiol. 2013 Aug 1;305(3):G225-40. doi: 10.1152/ajpgi.00091.2013. Epub 2013 May 23. Am J Physiol Gastrointest Liver Physiol. 2013. PMID: 23703655 Free PMC article. - Mammary tumor heterogeneity in the expansion of myeloid-derived suppressor cells.
Donkor MK, Lahue E, Hoke TA, Shafer LR, Coskun U, Solheim JC, Gulen D, Bishay J, Talmadge JE. Donkor MK, et al. Int Immunopharmacol. 2009 Jul;9(7-8):937-48. doi: 10.1016/j.intimp.2009.03.021. Epub 2009 Apr 9. Int Immunopharmacol. 2009. PMID: 19362167 - Cat2 L-arginine transporter-deficient fibroblasts can sustain nitric oxide production.
Nicholson B, Manner CK, MacLeod CL. Nicholson B, et al. Nitric Oxide. 2002 Dec;7(4):236-43. doi: 10.1016/s1089-8603(02)00116-7. Nitric Oxide. 2002. PMID: 12446172 - Myeloid-Derived Suppressor Cells in Trypanosoma cruzi Infection.
Fresno M, Gironès N. Fresno M, et al. Front Cell Infect Microbiol. 2021 Aug 27;11:737364. doi: 10.3389/fcimb.2021.737364. eCollection 2021. Front Cell Infect Microbiol. 2021. PMID: 34513737 Free PMC article. Review. - PGE(2)-driven induction and maintenance of cancer-associated myeloid-derived suppressor cells.
Obermajer N, Wong JL, Edwards RP, Odunsi K, Moysich K, Kalinski P. Obermajer N, et al. Immunol Invest. 2012;41(6-7):635-57. doi: 10.3109/08820139.2012.695417. Immunol Invest. 2012. PMID: 23017139 Review.
Cited by
- Natural Killer Cell Interactions With Myeloid Derived Suppressor Cells in the Tumor Microenvironment and Implications for Cancer Immunotherapy.
Zalfa C, Paust S. Zalfa C, et al. Front Immunol. 2021 May 5;12:633205. doi: 10.3389/fimmu.2021.633205. eCollection 2021. Front Immunol. 2021. PMID: 34025641 Free PMC article. Review. - CXCR4-modified CAR-T cells suppresses MDSCs recruitment via STAT3/NF-κB/SDF-1α axis to enhance efficacy against pancreatic cancer.
Sun R, Sun Y, Wu C, Liu Y, Zhou M, Dong Y, Du G, Luo H, Shi B, Jiang H, Li Z. Sun R, et al. Mol Ther. 2023 Nov 1;31(11):3193-3209. doi: 10.1016/j.ymthe.2023.09.010. Epub 2023 Sep 20. Mol Ther. 2023. PMID: 37735875 Free PMC article. - Identification of inhibitors of myeloid-derived suppressor cells activity through phenotypic chemical screening.
Schröder M, Loos S, Naumann SK, Bachran C, Krötschel M, Umansky V, Helming L, Swee LK. Schröder M, et al. Oncoimmunology. 2016 Nov 29;6(1):e1258503. doi: 10.1080/2162402X.2016.1258503. eCollection 2017. Oncoimmunology. 2016. PMID: 28197378 Free PMC article. - Possible Metastatic Stage-Dependent ILC2 Activation Induces Differential Functions of MDSCs through IL-13/IL-13Rα1 Signaling during the Progression of Breast Cancer Lung Metastasis.
Ito A, Akama Y, Satoh-Takayama N, Saito K, Kato T, Kawamoto E, Gaowa A, Park EJ, Takao M, Shimaoka M. Ito A, et al. Cancers (Basel). 2022 Jul 4;14(13):3267. doi: 10.3390/cancers14133267. Cancers (Basel). 2022. PMID: 35805039 Free PMC article. - Research progress on the role of cationic amino acid transporter (CAT) family members in malignant tumors and immune microenvironment.
You S, Han X, Xu Y, Yao Q. You S, et al. Amino Acids. 2023 Oct;55(10):1213-1222. doi: 10.1007/s00726-023-03313-1. Epub 2023 Aug 12. Amino Acids. 2023. PMID: 37572157 Review.
References
- Casbon AJ, Reynaud D, Park C, Khuc E, Gan DD, Schepers K, Passegue E, Werb Z. Invasive breast cancer reprograms early myeloid differentiation in the bone marrow to generate immunosuppressive neutrophils. Proceedings of the National Academy of Sciences of the United States of America. 2015;112:E566–575. - PMC - PubMed
- Walter S, Weinschenk T, Stenzl A, Zdrojowy R, Pluzanska A, Szczylik C, Staehler M, Brugger W, Dietrich PY, Mendrzyk R, Hilf N, Schoor O, Fritsche J, Mahr A, Maurer D, Vass V, Trautwein C, Lewandrowski P, Flohr C, Pohla H, Stanczak JJ, Bronte V, Mandruzzato S, Biedermann T, Pawelec G, Derhovanessian E, Yamagishi H, Miki T, Hongo F, Takaha N, Hirakawa K, Tanaka H, Stevanovic S, Frisch J, Mayer-Mokler A, Kirner A, Rammensee HG, Reinhardt C, Singh-Jasuja H. Multipeptide immune response to cancer vaccine IMA901 after single-dose cyclophosphamide associates with longer patient survival. Nature medicine. 2012;18:1254–1261. - PubMed
- Gabitass RF, Annels NE, Stocken DD, Pandha HA, Middleton GW. Elevated myeloid-derived suppressor cells in pancreatic, esophageal and gastric cancer are an independent prognostic factor and are associated with significant elevation of the Th2 cytokine interleukin-13. Cancer immunology, immunotherapy : CII. 2011;60:1419–1430. - PMC - PubMed
Publication types
MeSH terms
Substances
Grants and funding
- CA023168/CA/NCI NIH HHS/United States
- K22CA118182/CA/NCI NIH HHS/United States
- K22 CA118182/CA/NCI NIH HHS/United States
- R01 DK084454/DK/NIDDK NIH HHS/United States
- DK084454/DK/NIDDK NIH HHS/United States
- R21 CA173918/CA/NCI NIH HHS/United States
- P30 CA023168/CA/NCI NIH HHS/United States
- CA173918/CA/NCI NIH HHS/United States
LinkOut - more resources
Full Text Sources
Other Literature Sources
Medical
Molecular Biology Databases
Research Materials
Miscellaneous


