Anvi'o: an advanced analysis and visualization platform for 'omics data - PubMed (original) (raw)
Anvi'o: an advanced analysis and visualization platform for 'omics data
A Murat Eren et al. PeerJ. 2015.
Abstract
Advances in high-throughput sequencing and 'omics technologies are revolutionizing studies of naturally occurring microbial communities. Comprehensive investigations of microbial lifestyles require the ability to interactively organize and visualize genetic information and to incorporate subtle differences that enable greater resolution of complex data. Here we introduce anvi'o, an advanced analysis and visualization platform that offers automated and human-guided characterization of microbial genomes in metagenomic assemblies, with interactive interfaces that can link 'omics data from multiple sources into a single, intuitive display. Its extensible visualization approach distills multiple dimensions of information about each contig, offering a dynamic and unified work environment for data exploration, manipulation, and reporting. Using anvi'o, we re-analyzed publicly available datasets and explored temporal genomic changes within naturally occurring microbial populations through de novo characterization of single nucleotide variations, and linked cultivar and single-cell genomes with metagenomic and metatranscriptomic data. Anvi'o is an open-source platform that empowers researchers without extensive bioinformatics skills to perform and communicate in-depth analyses on large 'omics datasets.
Keywords: Assembly; Genome binning; Metagenomics; Metatranscriptomics; SNP profiling; Visualization.
Conflict of interest statement
The authors declare there are no competing interests.
Figures
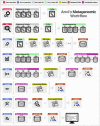
Figure 1. Overview of the anvi’o metagenomic workflow.
Anvi’o can perform comprehensive analysis of BAM files following the initial steps of co-assembly and mapping. Initial processing of contigs and profiling each BAM file individually generate all the essential databases anvi’o uses throughout the downstream processing. Anvi’o can merge single profile databases, during which the unsupervised binning module would exploit the differential distribution patterns of contigs across samples to identify genome bins automatically, and store binning results as a collection. The optional visualization step gives the user the opportunity to interactively work with the data, and perform supervised binning with real-time completion and redundancy estimates based on the presence or absence of bacterial single-copy genes. The user can screen and refine genome bins, and split a single mixed genome bin into multiple bins with low redundancy estimates. Finally, the user can summarize collections that describe genome bins, which would create a static web site that would contain necessary information to review each genome bin, and to analyze their occurrence across samples.
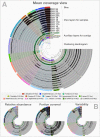
Figure 2. Static images from the anvi’o interactive display for the infant gut dataset with genome bins.
The clustering dendrogram in the center of (A) displays the hierarchical clustering of contigs based on their sequence composition, and their distribution across samples. Each tip on this dendrogram represents a split (anvi’o divides a contig into multiple splits if it is longer than a certain amount of nucleotides, which is 20,000 bps in this example). Each auxiliary layer represents essential information for each split that is independent of their distribution among samples. In this example auxiliary layers from the inside out include (1) the parent layer that marks splits originate from the same contigs with gray bars, (2) the RAST taxonomy layer that shows the consensus taxonomy for each open reading frame found in a given split, (3) the number of genes layer that shows the number of open reading frames identified in a given split, (4) the ratio with taxonomy layer that shows the proportion of the number of open reading frames with a taxonomical hit in a given split, (5) the length layer that shows the actual length of a given split, and finally (6) the GC-content layer. The view layers for samples follow the auxiliary layers section. In the view layers section each layer represents a sample, and each bar represents a datum computed for a given split in a given sample. (A) demonstrates the “mean coverage”, where the datum for each bar is the average coverage of a given split in a given sample. (B) exemplifies three other views for the same display: “relative abundance”, “portion covered”, and “variability” of splits among samples.
Figure 3. Variable nucleotide positions in contigs for three draft genome bins.
The figure displays for each genome bin in each sample (from top to bottom), (1) average coverage values for all splits, (2) variation density (number of variable positions reported during the profiling step per kilo base pairs), (3) heatmap of variable nucleotide positions, (4) ratio of variable nucleotide identities, and finally (5) the ratio of transitions (mutations that occur from A to G, or T to C, and vice versa) versus transversions. In the heatmap, each row represents a unique variable nucleotide position, where the color of each tile represents the nucleotide identity, and the shade of each tile represents the square root-normalized ratio of the most frequent two bases at that position (i.e., the more variation in a nucleotide position, the less pale the tile is).
Figure 4. Overholt culture isolates linked to the Rodriguez-R metagenomes of the beach sand microbial community.
The tree on the left displays the hierarchical clustering of 10 culture genomes based on sequence composition. Each view layer represents the “percent coverage” of each split in the Pensacola beach metagenomic dataset. The tree on the right displays the coverage-based hierarchical clustering of 56 environmental draft genomes we determined from the co-assembly of Pensacola Beach metagenomic dataset. The view layers display the “mean coverage” of each split in samples from the Pensacola beach metagenomic dataset. The most outer layer in both trees show the ecological pattern of a given genome bin during the period of sampling. Letters A to J identify culture genomes, and numbers 1 to 56 identify each metagenomic bin. The letter F, and the number 24, identifies two bins that represent the only genome that was present in both collections (Alcanivorax sp. P2S70). All genus- and higher-level taxonomy assignments are based on the best-hit function in RAST.
Figure 5. Mapping of samples to SAGs and metagenomic assembly, and nucleotide frequencies and identities of variable positions in three bins.
(A) shows the mapping of Mason et al. (2012) and Mason et al. (2014) samples, as well as the three Yergeau et al. (2015) depth profiles collected from a location close to Mason et al.’s proximal station, to the co-assembly of the three SAGs. The dendrogram shows the sequence composition-based hierarchical clustering of the community contigs with the “portion covered” view, where each bar in the sample layers represents the percentage of coverage of a given contig by at least one short read in a given sample (i.e., if each nucleotide position in a contig is covered by at least one read, the bar is full). (B) shows the mapping of the same samples to the co-assembly of the three Mason et al. metagenomes. The dendrogram shows the sequence composition- and coverage-based hierarchical clustering of the community contigs with the “mean coverage” view, where each bar in the sample layers represents the average coverage of a given contig in a given sample. Bar charts on the left-side of dendrograms both in (A) and (B) show the percent mapped reads from each sample to the assembly. (C) compares the identity and frequency of the competing nucleotides at the co-occurring variable positions in three bins identified in the (B): DWH O. desum, DWH Cryptic, and DWH Unknown. _X_- and _Y_-axes in each of the three plots represent the ratio of the second most frequent base (_n_2) in a variable position to the most frequent base (_n_1) in distal, and proximal samples, respectively. Each dot on a plot represents a variable nucleotide position. The color of a given dot represents the identity of competing nucleotides. The size of a given dot increases if the coverage of it is similar in both samples, where size equals to ‘1—std(coverage in proximal, coverage in distal)’. Linear regression lines show the correlation between the base frequencies at variable nucleotide positions. Each plot also displays the _R_2 values for linear regressions, and the ratio of transition versus transversion rates (k).
Similar articles
- SQMtools: automated processing and visual analysis of 'omics data with R and anvi'o.
Puente-Sánchez F, García-García N, Tamames J. Puente-Sánchez F, et al. BMC Bioinformatics. 2020 Aug 14;21(1):358. doi: 10.1186/s12859-020-03703-2. BMC Bioinformatics. 2020. PMID: 32795263 Free PMC article. - MOSCA 2.0: A bioinformatics framework for metagenomics, metatranscriptomics and metaproteomics data analysis and visualization.
Sequeira JC, Pereira V, Alves MM, Pereira MA, Rocha M, Salvador AF. Sequeira JC, et al. Mol Ecol Resour. 2024 Oct;24(7):e13996. doi: 10.1111/1755-0998.13996. Epub 2024 Aug 4. Mol Ecol Resour. 2024. PMID: 39099161 - A high-quality fungal genome assembly resolved from a sample accidentally contaminated by multiple taxa.
Aylward J, Wingfield MJ, Roets F, Wingfield BD. Aylward J, et al. Biotechniques. 2022 Feb;72(2):39-50. doi: 10.2144/btn-2021-0097. Epub 2021 Nov 30. Biotechniques. 2022. PMID: 34846173 - Visualizing metagenomic and metatranscriptomic data: A comprehensive review.
Aplakidou E, Vergoulidis N, Chasapi M, Venetsianou NK, Kokoli M, Panagiotopoulou E, Iliopoulos I, Karatzas E, Pafilis E, Georgakopoulos-Soares I, Kyrpides NC, Pavlopoulos GA, Baltoumas FA. Aplakidou E, et al. Comput Struct Biotechnol J. 2024 May 3;23:2011-2033. doi: 10.1016/j.csbj.2024.04.060. eCollection 2024 Dec. Comput Struct Biotechnol J. 2024. PMID: 38765606 Free PMC article. Review.
Cited by
- Identification of a Metagenome-Assembled Genome of an Uncultured Methyloceanibacter sp. Strain Acquired from an Activated Sludge System Used for Landfill Leachate Treatment.
Yasuda S, Suenaga T, Orschler L, Agrawal S, Lackner S, Terada A. Yasuda S, et al. Microbiol Resour Announc. 2020 Aug 6;9(32):e00771-20. doi: 10.1128/MRA.00771-20. Microbiol Resour Announc. 2020. PMID: 32763946 Free PMC article. - Basin-scale biogeography of Prochlorococcus and SAR11 ecotype replication.
Larkin AA, Hagstrom GI, Brock ML, Garcia NS, Martiny AC. Larkin AA, et al. ISME J. 2023 Feb;17(2):185-194. doi: 10.1038/s41396-022-01332-6. Epub 2022 Oct 22. ISME J. 2023. PMID: 36273241 Free PMC article. - Insight into phenotypic and genotypic differences between vaginal Lactobacillus crispatus BC5 and Lactobacillus gasseri BC12 to unravel nutritional and stress factors influencing their metabolic activity.
Costantini PE, Firrincieli A, Fedi S, Parolin C, Viti C, Cappelletti M, Vitali B. Costantini PE, et al. Microb Genom. 2021 Jun;7(6):000575. doi: 10.1099/mgen.0.000575. Microb Genom. 2021. PMID: 34096840 Free PMC article. - Metagenome-assembled genomes reveal greatly expanded taxonomic and functional diversification of the abundant marine Roseobacter RCA cluster.
Liu Y, Brinkhoff T, Berger M, Poehlein A, Voget S, Paoli L, Sunagawa S, Amann R, Simon M. Liu Y, et al. Microbiome. 2023 Nov 25;11(1):265. doi: 10.1186/s40168-023-01644-5. Microbiome. 2023. PMID: 38007474 Free PMC article. - Genome Investigation of Urinary Gardnerella Strains and Their Relationship to Isolates of the Vaginal Microbiota.
Putonti C, Thomas-White K, Crum E, Hilt EE, Price TK, Wolfe AJ. Putonti C, et al. mSphere. 2021 May 12;6(3):e00154-21. doi: 10.1128/mSphere.00154-21. mSphere. 2021. PMID: 33980674 Free PMC article.
References
- Alonso-Sáez L, Waller AS, Mende DR, Bakker K, Farnelid H, Yager PL, Lovejoy C, Tremblay J-É, Potvin M, Heinrich F, Estrada M, Riemann L, Bork P, Pedros-Alio C, Bertilsson S. Role for urea in nitrification by polar marine Archaea. Proceedings of the National Academy of Sciences of the United States of America. 2012;109:17989–17994. doi: 10.1073/pnas.1201914109. - DOI - PMC - PubMed
- Angly FE, Felts B, Breitbart M, Salamon P, Edwards RA, Carlson C, Chan AM, Haynes M, Kelley S, Liu H, Mahaffy JM, Mueller JE, Nulton J, Olson R, Parsons R, Rayhawk S, Suttle CA, Rohwer F. The marine viromes of four oceanic regions. PLoS Biology. 2006;4:e1319. doi: 10.1371/journal.pbio.0040368. - DOI - PMC - PubMed
LinkOut - more resources
Full Text Sources
Other Literature Sources


