The transcription factors ZEB2 and T-bet cooperate to program cytotoxic T cell terminal differentiation in response to LCMV viral infection - PubMed (original) (raw)
The transcription factors ZEB2 and T-bet cooperate to program cytotoxic T cell terminal differentiation in response to LCMV viral infection
Claudia X Dominguez et al. J Exp Med. 2015.
Abstract
The transcription factor T-bet is critical for cytotoxic T lymphocyte (CTL) differentiation, but it is unclear how it operates in a graded manner in the formation of both terminal effector and memory precursor cells during viral infection. We find that, at high concentrations, T-bet induced expression of Zeb2 mRNA, which then triggered CTLs to adopt terminally differentiated states. ZEB2 and T-bet cooperate to switch on a terminal CTL differentiation program, while simultaneously repressing genes necessary for central memory CTL development. Chromatin immunoprecipitation sequencing showed that a large proportion of these genes were bound by T-bet, and this binding was altered by ZEB2 deficiency. Furthermore, T-bet overexpression could not fully bypass ZEB2 function. Thus, the coordinated actions of T-bet and ZEB2 outline a novel genetic pathway that forces commitment of CTLs to terminal differentiation, thereby restricting their memory cell potential.
© 2015 Dominguez et al.
Figures
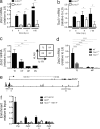
Figure 1.
ZEB2 is expressed in terminally differentiated effector CTLs in a T-bet-dependent manner. (a and b) Zeb2 mRNA (a) or Tbx21 mRNA (b) was measured in purified CD44lo CD62Lhi naive CD8+ T cells (day 0) or KLRG1hi (black bars) or KLRG1lo (white bars) LCMV-specific CD8+ T cells from 6, 8, or >60 d.p.i. using qRT-PCR. LCMV-specific CD8+ T cells were isolated based on staining for DbGP33-41-tetramer. (c) Effector P14 CD8+ T cells isolated 8 d.p.i. were purified based on KLRG1hi IL-7Rlo (TE), KLRG1hi IL-7Rhi (double positive, DP), KLRG1lo IL-7Rhi (MP), or KLRG1lo IL-7Rlo (double negative, DN) expression and the amount of Zeb2 mRNA was measured in the indicated subsets using qRT-PCR. (d) Zeb2 mRNA levels were compared between sorted WT, Tbx21+/−, and Tbx21−/− TE (KLRG1hi IL-7Rlo) or MP (KLRG1lo IL-7Rhi) P14 CTLs 8 d.p.i. (e) T-bet ChIP-seq was performed on effector P14 CD8+ T cells isolated 8 d.p.i. and stimulated in brief with IL-12. T-bet binding was visualized using the UCSC Genome Browser. Outline of the murine Zeb2 locus with exons (black boxes), the transcriptional start site (TSS, probe II), an additional T-bet binding site (−3 kb, probe I), and an internal negative control site (exon8-neg, probe III) noted. (f) Bar graph shows the amount of T-bet bound to regions I and II in the Zeb2 locus in WT (black bars) or Tbx21−/− (white bars) effector P14 CTLs from 8 d.p.i. based on ChIP using anti–T-bet or isotype IgG control (gray bars), followed by qRT-PCR. T-bet binding to the _IFN_γ promoter or Zeb2 exon8 are shown as positive and negative controls, respectively (Cho et al., 2003). Data shown in a–d and f are representative of three to five experiments (n = 4–5 mice/group/independent experiment); panel e displays data from a single sequencing run. Bars represent mean expression ± SEM. *, P < 0.05; **, P < 0.01; ***, P < 0.001.
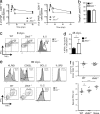
Figure 2.
ZEB2-deficient CD8+ T cells acquire CTL functions during LCMV infection. (a) WT (filled square) and Zeb2−/− (open circle) mice were infected with LCMV and splenic DbGP33-41 and DbNP396-404 tetramer+ CTLs were quantitated at 6, 8, 15, and 60 d.p.i. Data pooled for each time point are from two (day 6) or >3 (day 8–60) independent experiments containing three to five mice per group. (b) in vivo cytotoxicity assays using CFSE-labeled GP33-41 peptide-coated splenocytes as targets were performed in LCMV-infected WT or Zeb2−/− mice at 8 d.p.i. Data are pooled from two independent experiments (n = 3–4 mice/group). (c) WT and Zeb2−/− CTLs from 8 d.p.i. were analyzed for IFNγ and TNF (left contour plots) or IL-2 (right histogram plots) expression using intracellular cytokine staining after a 5-h GP33-41 peptide stimulation. Note, IL-2–producing cells were gated on IFNγ+ TNF+ CTLs. Data are representative of >6 independent experiments (n = 4–5 mice/group). (d) To measure rates of homeostatic turnover in memory CD8+ T cells, mice infected with LCMV-Arm 35 d before were administered BrdU in their drinking water for 10 d, and the frequency of BrdU+ DbGP33-41 and DbNP396-404 tetramer+ CTLs in the spleen was determined by intracellular staining and flow cytometry at 45 d.p.i. Data are pooled from two independent experiments containing n = 3–5 mice/group. (e) P14 chimeric mice were infected with LCMV-Arm and sacrificed at 80 d.p.i. and analyzed for expression of KLRG1, CD62L, Bcl-2, and IL-2Rβ (top) as well as cytokine production in response to peptide restimulation (bottom) Histograms show percentage or MFI of markers as indicated. IL-2 expression plot is gated on IFN-γ and TNF double-producing cells. Data are representative of two independent experiments containing n = 5 mice/group. Bars represent mean expression ± SEM. (f) For rechallenge experiments, 60,000 memory WT (black circles) or Zeb2−/− (open circles) P14 CD8+ T cells (from 60+ d.p.i.) were transferred into naive mice that were then infected with clone 13 LCMV. 6 d later, the number of donor P14 CTLs in the spleen (top) and viral titers in the serum (bottom) were measured. Data are representative of three independent experiments containing n = 3–5 mice/group. Bars represent mean expression ± SEM. *, P < 0.05; **, P < 0.01; ****, P < 0.0001.
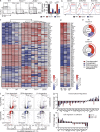
Figure 3.
Zeb2−/− CTLs are impaired in TE cell differentiation. (a) WT (black) and Zeb2−/− (white) mice were infected with LCMV-Arm and the frequency (left plots) and numbers (right bar graph) of tetramer+ CTL subsets, as defined by KLRG1 and IL-7R expression was assessed by flow cytometry. Bar graph shows cumulative numbers of DbGP33-41- and DbNP396-404-specific CTLs combined. (b and c) WT (black bars) or Zeb2−/− (white bars) P14 chimeric mice were infected with LCMV-Arm and sacrificed 8 d.p.i. Bar graphs show the expression of several surface and cytotoxic molecules (b) and transcription factors (c) in P14 TE (KLRG1hi IL7Rlo) and MP (KLRG1lo IL7Rhi) cells as assessed by flow cytometry or qRT-PCR. *, P < 0.05; **, P < 0.01; ****, P < 0.0001. Data are representative of greater than five experiments (n = 4–5 mice/group). (d) WT and Zeb2−/− P14 CD8+ T cells from 8 d.p.i. were sorted based on KLRG1hi IL7Rlo and KLRG1lo IL7Rhi expression to normalize according to phenotype. mRNA was isolated from the four sample groups in triplicate and hybridized to Illumina MouseWG-6 v2.0 microarrays to compare differentially expressed genes within each subset between _Zeb2−/_− versus WT cells. Data were analyzed using the limma package in R and a heat map of select top statistically significant (*, FDR < 0.01, Benjamini-Hochberg) differentially expressed MP and TE genes is shown, with statistical significance achieved in the TE subset fold-change (left column). Sidebar denotes MP- (green) and TE-signature (gold) genes.
Figure 4.
ZEB2 cooperates with T-bet to regulate a subset of genes. (a) Contour plots and bar graph show frequency of subsets, as defined by KLRG1 and IL-7Rα expression in splenic WT, _Zeb2_−/−, or _Tbx21_−/− P14 CTLs 8 d.p.i. (b) Representative histograms show expression of indicated receptor in the respective P14 TE cell population. (c–f) Genome-wide mRNA expression profiling was performed on MP and TE cells as well as total WT, Tbx21−/−, and Zeb2−/− P14 CD8+ T cells at day 8 d.p.i. Differentially expressed genes were defined as ≥1.5 fold different between 2 groups with a FDR of < 0.1. (c) Heat map shows the mRNA expression of the top 50 most differentially expressed genes between MP and TE cell populations, in addition to select biologically relevant genes (*) in these subsets as well as T-bet– and ZEB2-deficient CTLs. (d) Heat map shows the log2 ratio of MP versus TE cell expression of these genes and how this compares to the differential expression between T-bet−/− and Zeb2−/− versus WT CTLs. (e) Pie graphs show the total numbers of MP- and TE-signature genes subdivided by the frequency of genes that are dependent on T-bet (red), ZEB2 (blue), or both (codependent, purple) for normal expression. (f) Volcano plots show differential expression of MP and TE signature genes. Genes up-regulated (top) or down-regulated (bottom) in Tbx21−/− CTLs (red), Zeb2−/− CTLs (blue), or in both (purple) are highlighted. A few genes of biological significance genes are highlighted. (g) The MP and TE signature genes were subdivided into functional categories as indicated, based on known or predicted functions (e.g., transcriptional regulators, cell adhesion/migration). Bar graphs show the fold change (log2 ratio) of differentially expressed genes between MP and TE, Tbx21−/− and WT, as well as Zeb2−/− and WT CTLs (≥ 1.5-fold change with a FDR ≤ 0.1). * denote biologically relevant genes that were either not differentially expressed, or not statistically significant. Data are representative of four independent experiments (n = 4–5 mice/group) in a and b and two (Zeb2−/− CTLs) or three (all other groups) independent biological replicates (c–f; n = 4–5 mice/group/replicate). Bars represent mean expression ± SEM. ****, P < 0.0001.
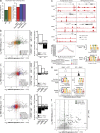
Figure 5.
ZEB2 is required for normal amounts of T-bet binding at several TE genes that are codependent on T-bet and ZEB2. Total P14 CTLs were purified at 8 d.p.i. and samples were processed for T-bet ChIP-Seq in WT and Zeb2−/−, as described in Materials and methods. (a) Bar graphs show the frequency of genes in the indicated gene signature sets (with number of genes inscribed) annotated to contain TBSs as determined based on the MACS v2.1.0 analysis (FDR < 1 × 10⁻⁵). (b–e) TBSs were annotated to the nearest gene and compared between WT and _Zeb2−/−_ CTLs for differential T-bet binding (FDR < 1 × 10⁻⁵). TBS displaying decreased or increased T-bet binding in _Zeb2−/−_ versus WT cells were categorized as WT > Zeb2−/− or Zeb2−/− > WT, respectively. (b) Scatter plots quantitate the log2 fold-change in T-bet binding versus the log2 fold-change in mRNA expression in Zeb2−/− versus WT. Dashed lines designate fold-changes of 1.5; bar graphs to right show the number of genes within each signature (with frequency inscribed) that display increased (white bar) or decreased (black bar) T-bet binding in Zeb2−/− relative to WT cells. Genes contained within the MP (green), TE (gold), T-bet-dependent (red), ZEB2-dependent (blue), or codependent (purple) gene signatures are shown. (c) T-bet ChIP-seq tracks from Zeb2−/− and WT CTLs at select MP and TE loci are shown with differential TBS identified below the tracks. (d) Motif discovery and enrichment analysis of DNA sequences flanking the summits of TBS common between WT and Zeb2−/− CD8 T cells identified several known centrally enriched motifs that included T-box consensus sequences for Eomes and T (i.e., brachyury or T-box) in addition to Runx1/2. Line graph (top) notes positions of indicated motifs. De novo motif discovery was performed in parallel on the TBS and the most significantly enriched motif (GSTGTGR) along with its most similar motif (T) is shown (bottom). (e) Motif discovery and enrichment analysis was performed among the differential TBS between WT and Zeb2−/− CD8 T cells (Zeb2−/− > WT or WT > Zeb2−/−), as diagrammed. The most highly enriched motif discovered and the E-value of enrichment are shown along with its most similar motif and its corresponding E-value. (f) Scatter plot from panel b highlighting loci containing the CAGGTRW discovered by motif enrichment analysis as putative ZEB2-binding sites.
Figure 6.
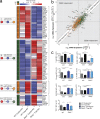
ZEB2 is necessary for the regulation of several MP and TE-signature genes. WT or Zeb2−/− P14 CD8+ T cells were transduced with MigR1 retroviruses (RVs) overexpressing T-bet (T-bet RV) or empty control RVs, which generated four experimental groups. After transduction, 105 P14 CTLs were transferred into naive B6 recipients that were subsequently infected with LCMV-Arm, and 8 d.p.i. the RV-infected KLRG1hi P14 CTLs were sorted and processed for RNA-seq (a and b) or the total RV-infected P14 CTL population was examined for expression of particular receptors and transcription factors by flow cytometry (c). (a) Heat map shows genes within the MP and TE signatures that are induced or repressed by T-bet, and operate in either a ZEB2-dependent or -independent manner. Genes are divided into four clusters (I–IV) highlighting these different models of regulation (right of heat map). (b) Scatter plot of mRNA expression between Zeb2−/− versus WT (x-axis) and Zeb2−/− + T-bet RV versus WT (y-axis). Solid diagonal line represents the similarity of gene expression and the dashed lines show division of genes for which T-bet overexpression increased or decreased expression by ±1.5-fold-change. Thus, genes in gray sections represent those in which T-bet could induce or repress independent of ZEB2 and genes in white section, along solid diagonal line, represent those in which T-bet was dependent on ZEB2 to modulate. MP- and TE-signature genes are highlighted with green and gold colors (a and b). (c) Representative bar graphs show protein expression in the four groups of CTLs as assessed by flow cytometry. Data are representative of three (a–b) and four (c) independent experiments (n = 4–5 mice/group). Bars represent mean expression ± SEM. *, P < 0.05; **, P < 0.01; ***, P < 0.001; ***, P < 0.0001; ****, P < 0.0001.
Comment in
- Effective effector generation of CD8+ T cells and NK cells: A need for T-bet and ZEB-too.
Hamilton SE, Jameson SC. Hamilton SE, et al. J Exp Med. 2015 Nov 16;212(12):1990. doi: 10.1084/jem.21212insight3. J Exp Med. 2015. PMID: 26573585 Free PMC article. No abstract available.
Similar articles
- Transcriptional repressor ZEB2 promotes terminal differentiation of CD8+ effector and memory T cell populations during infection.
Omilusik KD, Best JA, Yu B, Goossens S, Weidemann A, Nguyen JV, Seuntjens E, Stryjewska A, Zweier C, Roychoudhuri R, Gattinoni L, Bird LM, Higashi Y, Kondoh H, Huylebroeck D, Haigh J, Goldrath AW. Omilusik KD, et al. J Exp Med. 2015 Nov 16;212(12):2027-39. doi: 10.1084/jem.20150194. Epub 2015 Oct 26. J Exp Med. 2015. PMID: 26503445 Free PMC article. - Complex Interplay Between MAZR and Runx3 Regulates the Generation of Cytotoxic T Lymphocyte and Memory T Cells.
Gülich AF, Rica R, Tizian C, Viczenczova C, Khamina K, Faux T, Hainberger D, Penz T, Bosselut R, Bock C, Laiho A, Elo LL, Bergthaler A, Ellmeier W, Sakaguchi S. Gülich AF, et al. Front Immunol. 2021 Mar 17;12:535039. doi: 10.3389/fimmu.2021.535039. eCollection 2021. Front Immunol. 2021. PMID: 33815354 Free PMC article. - Effective effector generation of CD8+ T cells and NK cells: A need for T-bet and ZEB-too.
Hamilton SE, Jameson SC. Hamilton SE, et al. J Exp Med. 2015 Nov 16;212(12):1990. doi: 10.1084/jem.21212insight3. J Exp Med. 2015. PMID: 26573585 Free PMC article. No abstract available. - An Updated Model for the Epigenetic Regulation of Effector and Memory CD8+ T Cell Differentiation.
Xu T, Pereira RM, Martinez GJ. Xu T, et al. J Immunol. 2021 Sep 15;207(6):1497-1505. doi: 10.4049/jimmunol.2100633. J Immunol. 2021. PMID: 34493604 Review. - T-bet+ B cells: A common denominator in protective and autoreactive antibody responses?
Myles A, Sanz I, Cancro MP. Myles A, et al. Curr Opin Immunol. 2019 Apr;57:40-45. doi: 10.1016/j.coi.2019.01.002. Epub 2019 Feb 19. Curr Opin Immunol. 2019. PMID: 30784957 Free PMC article. Review.
Cited by
- TET2 regulates early and late transitions in exhausted CD8+ T cell differentiation and limits CAR T cell function.
Dimitri AJ, Baxter AE, Chen GM, Hopkins CR, Rouin GT, Huang H, Kong W, Holliday CH, Wiebking V, Bartoszek R, Drury S, Dalton K, Koucky OM, Chen Z, Giles JR, Dils AT, Jung IY, O'Connor R, Collins S, Everett JK, Amses K, Sherrill-Mix S, Chandra A, Goldman N, Vahedi G, Jadlowsky JK, Young RM, Melenhorst JJ, Maude SL, Levine BL, Frey NV, Berger SL, Grupp SA, Porter DL, Herbst F, Porteus MH, Carty SA, Bushman FD, Weber EW, Wherry EJ, Jordan MS, Fraietta JA. Dimitri AJ, et al. Sci Adv. 2024 Nov 15;10(46):eadp9371. doi: 10.1126/sciadv.adp9371. Epub 2024 Nov 13. Sci Adv. 2024. PMID: 39536093 Free PMC article. - DNA methylation profiling identifies TBKBP1 as potent amplifier of cytotoxic activity in CMV-specific human CD8+ T cells.
Yu Z, Sasidharan-Nair V, Buchta T, Bonifacius A, Khan F, Pietzsch B, Ahmadi H, Beckstette M, Niemz J, Hilgendorf P, Mausberg P, Keller A, Falk C, Busch DH, Schober K, Cicin-Sain L, Müller F, Brinkmann MM, Eiz-Vesper B, Floess S, Huehn J. Yu Z, et al. PLoS Pathog. 2024 Sep 26;20(9):e1012581. doi: 10.1371/journal.ppat.1012581. eCollection 2024 Sep. PLoS Pathog. 2024. PMID: 39325839 Free PMC article. - Attenuated effector T cells are linked to control of chronic HBV infection.
Heim K, Sagar, Sogukpinar Ö, Llewellyn-Lacey S, Price DA, Emmerich F, Kraft ARM, Cornberg M, Kielbassa S, Knolle P, Wohlleber D, Bengsch B, Boettler T, Neumann-Haefelin C, Thimme R, Hofmann M. Heim K, et al. Nat Immunol. 2024 Sep;25(9):1650-1662. doi: 10.1038/s41590-024-01928-4. Epub 2024 Aug 28. Nat Immunol. 2024. PMID: 39198634 Free PMC article. - BRD7 as key factor in PBAF complex assembly and CD8+ T cell differentiation.
Huang F, Lin Y, Qiao Y, Yuan Y, Zhong Z, Luo B, Wu Y, Liu J, Chen J, Zhang W, Zhang H, Liu B. Huang F, et al. JCI Insight. 2024 Jul 2;9(15):e171605. doi: 10.1172/jci.insight.171605. JCI Insight. 2024. PMID: 38954484 Free PMC article. - Human γδ T cells in diverse tissues exhibit site-specific maturation dynamics across the life span.
Gray JI, Caron DP, Wells SB, Guyer R, Szabo P, Rainbow D, Ergen C, Rybkina K, Bradley MC, Matsumoto R, Pethe K, Kubota M, Teichmann S, Jones J, Yosef N, Atkinson M, Brusko M, Brusko TM, Connors TJ, Sims PA, Farber DL. Gray JI, et al. Sci Immunol. 2024 Jun 7;9(96):eadn3954. doi: 10.1126/sciimmunol.adn3954. Epub 2024 Jun 7. Sci Immunol. 2024. PMID: 38848342
References
Publication types
MeSH terms
Substances
Grants and funding
- R01 AI074699/AI/NIAID NIH HHS/United States
- T32 AI007019/AI/NIAID NIH HHS/United States
- F31 AI084500-01/AI/NIAID NIH HHS/United States
- R37 AI066232/AI/NIAID NIH HHS/United States
- 3R01AI07469905S/AI/NIAID NIH HHS/United States
- 3R01AI07469905/AI/NIAID NIH HHS/United States
- F31 AI084500/AI/NIAID NIH HHS/United States
- Howard Hughes Medical Institute/United States
- R01 AI066232/AI/NIAID NIH HHS/United States
LinkOut - more resources
Full Text Sources
Other Literature Sources
Molecular Biology Databases
Research Materials
