Nanoscale spatial organization of the HoxD gene cluster in distinct transcriptional states - PubMed (original) (raw)
Nanoscale spatial organization of the HoxD gene cluster in distinct transcriptional states
Pierre J Fabre et al. Proc Natl Acad Sci U S A. 2015.
Abstract
Chromatin condensation plays an important role in the regulation of gene expression. Recently, it was shown that the transcriptional activation of Hoxd genes during vertebrate digit development involves modifications in 3D interactions within and around the HoxD gene cluster. This reorganization follows a global transition from one set of regulatory contacts to another, between two topologically associating domains (TADs) located on either side of the HoxD locus. Here, we use 3D DNA FISH to assess the spatial organization of chromatin at and around the HoxD gene cluster and report that although the two TADs are tightly associated, they appear as spatially distinct units. We measured the relative position of genes within the cluster and found that they segregate over long distances, suggesting that a physical elongation of the HoxD cluster can occur. We analyzed this possibility by super-resolution imaging (STORM) and found that tissues with distinct transcriptional activity exhibit differing degrees of elongation. We also observed that the morphological change of the HoxD cluster in developing digits is associated with its position at the boundary between the two TADs. Such variations in the fine-scale architecture of the gene cluster suggest causal links among its spatial configuration, transcriptional activation, and the flanking chromatin context.
Keywords: DNA FISH; HoxD; limb development; super-resolution microscopy; topologically associating domains.
Conflict of interest statement
The authors declare no conflict of interest.
Figures
Fig. 1.
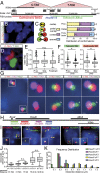
The HoxD cluster is at the interface between two TADs. (A) Schematic of the centromeric and telomeric TADs (C-TAD; T-TAD) using public data available under ref. with genes as black boxes below and the relative localization of the probes (in red, blue and green) used in the DNA FISH experiments. The red dotted line represents the TAD boundary within HoxD. (B) E12.5 distal forelimb nuclei stained with DAPI (blue) and the centromeric (red) and telomeric (green) TADs. (Scale bar, 1 µm.) (C) Schematic (Left) and distributions (Right) of the various configurations observed by FISH in B. Prox and Dist, proximal and distal limb cells, respectively. (D) An example of structured illumination microscopy showing the absence of overlap between the two TADs. (Scale bar, 500 nm.) (E and F) Quantifications of the parameters observed under B. (E) Distances between the centers of both TADs. n.s., nonsignificant, using a Kruskall-Wallis test followed by Dunn’s multiple comparison posttest. (F) Ellipticity measured for both the telomeric (left) and centromeric (right). *P < 0.0001, using unpaired t tests. (G) Position of the HoxD cluster for two alleles of a representative distal forelimb cell, using a fosmid probe specific for the genes Hoxd8 to Hoxd12 (green). The signal is scored between the centromeric (red) and telomeric (magenta) TADs. (Scale bar, 500 nm.) (Right) Close-ups of both alleles with white arrowheads showing an elongated HoxD cluster. (Scale bar, 200 nm.) (H–K) Distances between various probes localized within the HoxD cluster (H). (I) Forelimb cells nuclei stained with DAPI (blue) and DNA FISH (red and green) for different combinations of Hoxd fosmids (Top). (Scale bar, 500 nm.) (J) Quantification of the distribution of interprobe distances between selected pairs of probes. The statistical significance between datasets was tested using using Kruskall-Wallis test followed by Dunn’s multiple comparison posttest. All were significantly different (P < 0.05) except the ones indicated with n.s. See SI Appendix, Table S2 for details. (K) Frequency distribution of the measurements shown in J.
Fig. 2.
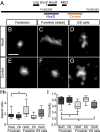
Distinct conformations of the HoxD cluster visible by STORM microscopy. (A) Schematic view of the two BAC clones, 160 and 175 kb large, respectively, used to visualize the HoxD cluster and part of the telomeric gene desert, using STORM imaging. (B–G) DNA FISH using Alexa 647 and resolved through STORM, using either “inactive” forebrain (B and E), “active” distal forelimb (C and F), or synchronized ES (D and G) cells. (Scale bar, 200 nm.) (H and I) For the same cells, quantifications of aspect ratio (H) and circularity (I) are shown, where the asterisk indicates P < 0.01, using a Kruskall-Wallis test followed by Dunn’s multiple comparison posttest (see SI Appendix, Materials and Methods).
Fig. 3.
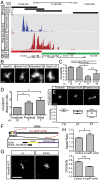
STORM analysis using smaller probes in different control and mutant tissues. (A) RNA profile of distal forelimb cells showing the expression of Hoxd8 to Hoxd13 (red) aligned with the positions of four fosmid probes (black, Top). The boundary between the centromeric (red) and telomeric (green) TADs is shown below, as well as the transcription of Evx2 from the other DNA strand (blue). (B) STORM imaging using the four probes under A and their relative circularity index (C). (Scale bar, B, 100 nm.) (D) Refined analysis of the Hoxd8 to Hoxd12 probe in forebrain, proximal limb, and distal limb cells, quantifying the level of dispersion as depicted in C and SI Appendix, Fig. S2_B_. (Scale bar, 200 nm.) (E) STORM imaging of the Hoxd8 to Hoxd12 probe in E10.5 embryos in cells positioned along the anterior to posterior axis. AT, anterior trunk; FB, forebrain; PT, posterior trunk. (Scale bar, 200 nm.) (F) Scheme of the 28-Mb large Inv(attP-cd44) inversion (red arrows) removing the telomeric TAD (purple), and location of the Hoxd8 to Hoxd12 probe (black). (G) STORM imaging of the Hoxd8 to Hoxd12 region in E12.5 distal forelimb cells from either a homozygous Inv(attP-cd44) embryo (Right) or control littermate (Left). (Scale bar, 200 nm.) (H) Quantification of the aspect ratio and circularity in both configurations shown under G. *P < 0.05 and ***P < 0.001, using Mann–Whitney U test. In C and D, **P < 0.01, using a Kruskall-Wallis test followed by Dunn’s multiple comparison posttest. n.s., not significant.
Similar articles
- Visualizing the HoxD Gene Cluster at the Nanoscale Level.
Fabre PJ, Benke A, Manley S, Duboule D. Fabre PJ, et al. Cold Spring Harb Symp Quant Biol. 2015;80:9-16. doi: 10.1101/sqb.2015.80.027177. Epub 2016 Jan 14. Cold Spring Harb Symp Quant Biol. 2015. PMID: 26767994 Review. - Chromatin topology and the timing of enhancer function at the HoxD locus.
Rodríguez-Carballo E, Lopez-Delisle L, Willemin A, Beccari L, Gitto S, Mascrez B, Duboule D. Rodríguez-Carballo E, et al. Proc Natl Acad Sci U S A. 2020 Dec 8;117(49):31231-31241. doi: 10.1073/pnas.2015083117. Epub 2020 Nov 23. Proc Natl Acad Sci U S A. 2020. PMID: 33229569 Free PMC article. - Large scale genomic reorganization of topological domains at the HoxD locus.
Fabre PJ, Leleu M, Mormann BH, Lopez-Delisle L, Noordermeer D, Beccari L, Duboule D. Fabre PJ, et al. Genome Biol. 2017 Aug 7;18(1):149. doi: 10.1186/s13059-017-1278-z. Genome Biol. 2017. PMID: 28784160 Free PMC article. - A role for HOX13 proteins in the regulatory switch between TADs at the HoxD locus.
Beccari L, Yakushiji-Kaminatsui N, Woltering JM, Necsulea A, Lonfat N, Rodríguez-Carballo E, Mascrez B, Yamamoto S, Kuroiwa A, Duboule D. Beccari L, et al. Genes Dev. 2016 May 15;30(10):1172-86. doi: 10.1101/gad.281055.116. Epub 2016 May 19. Genes Dev. 2016. PMID: 27198226 Free PMC article. - Colinearity loops out.
Duboule D, Deschamps J. Duboule D, et al. Dev Cell. 2004 Jun;6(6):738-40. doi: 10.1016/j.devcel.2004.05.016. Dev Cell. 2004. PMID: 15177018 Review.
Cited by
- Polycomb repression of Hox genes involves spatial feedback but not domain compaction or phase transition.
Murphy SE, Boettiger AN. Murphy SE, et al. Nat Genet. 2024 Mar;56(3):493-504. doi: 10.1038/s41588-024-01661-6. Epub 2024 Feb 15. Nat Genet. 2024. PMID: 38361032 - Abnormal Elongations of HOX Gene Clusters May Cause Cancer.
Papageorgiou S. Papageorgiou S. Front Cell Dev Biol. 2018 Mar 12;6:25. doi: 10.3389/fcell.2018.00025. eCollection 2018. Front Cell Dev Biol. 2018. PMID: 29662879 Free PMC article. No abstract available. - Modelling genome-wide topological associating domains in mouse embryonic stem cells.
Zhan Y, Giorgetti L, Tiana G. Zhan Y, et al. Chromosome Res. 2017 Mar;25(1):5-14. doi: 10.1007/s10577-016-9544-6. Epub 2017 Jan 20. Chromosome Res. 2017. PMID: 28108933 - Physical Laws Shape Up HOX Gene Collinearity.
Papageorgiou S. Papageorgiou S. J Dev Biol. 2021 May 6;9(2):17. doi: 10.3390/jdb9020017. J Dev Biol. 2021. PMID: 34066586 Free PMC article. Review. - Heterogeneous combinatorial expression of Hoxd genes in single cells during limb development.
Fabre PJ, Leleu M, Mascrez B, Lo Giudice Q, Cobb J, Duboule D. Fabre PJ, et al. BMC Biol. 2018 Sep 18;16(1):101. doi: 10.1186/s12915-018-0570-z. BMC Biol. 2018. PMID: 30223853 Free PMC article.
References
- Bickmore WA, van Steensel B. Genome architecture: Domain organization of interphase chromosomes. Cell. 2013;152(6):1270–1284. - PubMed
- de Laat W, Duboule D. Topology of mammalian developmental enhancers and their regulatory landscapes. Nature. 2013;502(7472):499–506. - PubMed
- Chambeyron S, Bickmore WA. Does looping and clustering in the nucleus regulate gene expression? Curr Opin Cell Biol. 2004;16(3):256–262. - PubMed
- Morey C, Da Silva NR, Perry P, Bickmore WA. Nuclear reorganisation and chromatin decondensation are conserved, but distinct, mechanisms linked to Hox gene activation. Development. 2007;134(5):909–919. - PubMed
Publication types
MeSH terms
Substances
LinkOut - more resources
Full Text Sources
Other Literature Sources
Molecular Biology Databases


