Histone H3 Threonine Phosphorylation Regulates Asymmetric Histone Inheritance in the Drosophila Male Germline - PubMed (original) (raw)
Histone H3 Threonine Phosphorylation Regulates Asymmetric Histone Inheritance in the Drosophila Male Germline
Jing Xie et al. Cell. 2015.
Abstract
A long-standing question concerns how stem cells maintain their identity through multiple divisions. Previously, we reported that pre-existing and newly synthesized histone H3 are asymmetrically distributed during Drosophila male germline stem cell (GSC) asymmetric division. Here, we show that phosphorylation at threonine 3 of H3 (H3T3P) distinguishes pre-existing versus newly synthesized H3. Converting T3 to the unphosphorylatable residue alanine (H3T3A) or to the phosphomimetic aspartate (H3T3D) disrupts asymmetric H3 inheritance. Expression of H3T3A or H3T3D specifically in early-stage germline also leads to cellular defects, including GSC loss and germline tumors. Finally, compromising the activity of the H3T3 kinase Haspin enhances the H3T3A but suppresses the H3T3D phenotypes. These studies demonstrate that H3T3P distinguishes sister chromatids enriched with distinct pools of H3 in order to coordinate asymmetric segregation of "old" H3 into GSCs and that tight regulation of H3T3 phosphorylation is required for male germline activity.
Copyright © 2015 Elsevier Inc. All rights reserved.
Figures
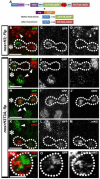
Figure 1. H3T3P distinguishes preexisting H3-GFP (green) from newly synthesized H3-mKO (red) in mitotic male GSCs
(A-B) A cartoon showing Drosophila testis tip and a model for asymmetric H3 inheritance during GSC asymmetric division. (A) A cartoon showing the asymmetric H3 inheritance during male GSC asymmetric cell division. (B) A schematic diagram of a two-step model to explain how asymmetric epigenome is established during S phase (Step one) and recognized followed by asymmetric segregation in M phase (Step two) GSC, adapted from (Tran et al., 2013). (C-E) A prophase GSC where GFP and mKO signals are separable. (F-H) A prophase GB where GFP and mKO signals are overlapping. (I-N) A prophase GSC where GFP and mKO signals are separable at some chromosomal region (I, L, M). Immunostaining using anti-H3T3P (N) showed H3T3P co-localization more with GFP (J, L, N) than with mKO (K, M, N). (O-T) A prophase GB where GFP and mKO signals are overlapping (O, R, S) and no preference of H3T3P (T) with either GFP (P, R) or mKO (Q, S). (U-Z) A metaphase GSC where GFP and mKO signals are undistinguishable (U, X, Y), H3T3P (Z) overlaps with both GFP (V, X) and mKO (W, Y). Asterisks in (C, I, L, U, X): hub. Scale bars: 5 μm. See also Figure S1.
Figure 2. Expression of an H3T3A transgene greatly reduces H3T3P in mitotic germ cells
(A-D) Tip of a testis expressing _nos_>H3T3A-GFP stained with antibodies against a hub marker FasIII, H3T3P and H3S10P. A prophase germ cell (yellow dotted outline) expressing H3T3A-GFP (A) is lack of H3T3P (B) but has abundant H3S10P (C) which co-localizes with condensed chromosome labeled by Hoechst staining (D). Two mitotic CySCs (white dotted outline) without H3T3A-GFP (A) has both H3T3P (B) and H3S10P (C) signals co-localized with condensed chromosome labeled by Hoechst staining (D). Asterisks: hub. (E-H) Mitotic germ cells (cyan dotted outline) expressing _nos_>H3-GFP (E) as a control have both H3T3P (F) and H3S10P (G) signals co-localized with condensed chromosome labeled by Hoechst staining (H). Scale bars: 5 μm. See also Figure S2.
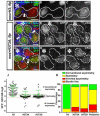
Figure 3. Expression of H3T3A changes the asymmetric H3 segregation pattern in mitotic GSCs
(A) A schematic diagram showing the dual color-switch design that expresses preexisting H3T3A-GFP and newly synthesized H3T3A-mKO by heat shock treatment, as adapted from (Tran et al., 2012). (B-D) A telophase GSC expressing _nos_>FRT-H3-GFP-PolyA-FRT-H3-mKOPolyA (_nos_>H3) during the second mitosis after heat shock-induced genetic switch show conventional asymmetric segregation pattern. (E-M) Telophase GSCs expressing _nos_>FRTH3T3A-GFP-PolyA-FRT-H3T3A-mKO-PolyA (_nos_>H3T3A) during the second mitosis after heat shock-induced genetic switch show conventional asymmetric segregation pattern (E-G), symmetric pattern (H-J), or inverted asymmetric pattern (K-M). (N-P) A prophase GSC expressing _nos_>FRT-H3T3A-GFP-PolyA-FRT-H3T3A-mKO-PolyA (_nos_>H3T3A) during the second mitosis after heat shock-induced genetic switch show separable GFP and mKO signals. Asterisk: hub. White dotted outline: mitotic GSCs at telophase (B-M) or prophase (N-P). Arrowheads: interphase GSCs or GBs which show much less condensed nuclei. Scale bars: 5 μm.
Figure 4. Expression of H3T3A or H3T3D changes preexisting and newly synthesized H3 distribution patterns in post-mitotic GSC-GB pairs
(A-I) Immunostaining signals using antibodies against a hub marker FasIII and spectrosome/fusome marker α-Spectrin in testes from _nos_>FRT-H3-GFP-PolyA-FRT-H3-mKO-PolyA (_nos_>H3, A-C) or _nos_>FRT-H3T3A-GFPPolyA-FRT-H3T3A-mKO-PolyA (_nos_>H3T3A, D-I) males after the second mitosis upon heat shock induced genetic switch. Asterisk: hub. White dotted outline: post-mitotic GSC-GB pairs. Arrowheads: spectrosome structure in between GSC and GB cells. Scale bars: 5 μm. (J) Quantification of the ratio of GFP (Y-axis: log2 scale) fluorescence intensity in GSC-GB pairs (see Figure S3A-B and Table S1 for details): _nos_>H3 (opened circle, N=55), _nos_>H3T3A (solid triangle, N=64), and _nos_>H3T3D (open square, N=57). Red dotted outline delineates symmetric distribution zone (see explanations below). H3 (N=55): GSC/GB GFP ratio= 10.11 ± 1.66 (P <10−4 for the ratio> 1, one-tailed t test). H3T3A (N=64): GSC/GB GFP ratio= 1.50 ± 0.28 (P > 0.05 therefore is insignificantly different from 1, two-tailed t test). H3T3D (N=57): GSC/GB GFP ratio= 1.56 ± 0.51 (P > 0.05 therefore is insignificantly different from 1, two-tailed t test). All ratios= Avg ± SE; _P_-value: One sample t test. (K) Percentage of GSC-GB pairs with conventional asymmetric (GFP in GSC/GB> 1.55), symmetric (GSC/GB GFP ratio between 1- 1.45 and GB/GSC GFP ratio between 1- 1.45), inverted asymmetric (GFP in GB/GSC> 1.55), and borderline (GSC/GB GFP ratio between 1.45- 1.55 and GB/GSC GFP ratio between 1.45- 1.55) patterns, respectively in _nos_>H3, _nos_>H3T3A, and _nos_>H3T3D testes, as well as the predicted patterns according to randomized segregation modeling (Table S2). In _nos_>H3 testes, conventional asymmetric: 87.3% (48/55); symmetric: 12.7% (7/55); no inverted asymmetric or borderline pairs. In _nos_>H3T3A testes, conventional asymmetric: 9.4% (6/64); symmetric: 71.9% (46/64); inverted asymmetric: 12.5% (8/64); borderline: 6.3% (4/64). In _nos_>H3T3D testes, conventional asymmetric: 7.0% (4/57); symmetric: 79.0% (45/57); inverted asymmetric: 10.5% (6/57); borderline: 3.5% (2/57). Predicted patterns: conventional asymmetric: 18.7% (12/64); symmetric: 53.1% (34/64); inverted asymmetric: 18.7% (12/64); borderline: 9.4% (6/64). See also Figure S3A-B and Table S1-2.
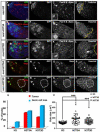
Figure 5. Both germline and somatic gonadal cells show defects in _nos_>H3T3A or nos>H3T3D testes
(A-L) Immunostaining using antibodies against a hub marker FasIII and spectrosome/fusome marker α-Spectrin in testes from _nos_>H3-GFP (A-D), _nos_>H3T3A-GFP (E-H), or _nos_>H3T3D-GFP (I-L) males seven days after eclosion. Asterisks in (A, E, I): hub. Arrowheads in (C, G, K) point to the hub region, which are shown with higher magnification in insets: hub size increases in _nos_>H3T3A-GFP (inset in G) or _nos_>H3T3D-GFP (inset in K) testes, but not in _nos_>H3-GFP (inset in C) testes. Early-stage germ cells, as determined by _nos_-driven GFP expression (B, F, J), and nuclear morphology (Chen et al., 2013; Tran et al., 2000) are delineated by the yellow dotted lines in (D, H, L). Scale bars: 20 αm. (M-T) Immunostaining using a germ cell specific anti-Vasa in testes from _nos_>H3T3A-GFP (M-P) or _nos_>H3T3D-GFP (Q-T) males. Both germ cell loss (M-T) and germline tumors (white dotted outline in Q-T) are detectable. Hoechst stains nuclei in (D, H, L, P, T). Scale bars: 20 μm. (U) Quantification of the percentage of testes with germline tumor and/or germ cell loss in testes expressing _nos_>H3-GFP (n=19), _nos_>H3T3A-GFP (n=42), or _nos_>H3T3D-GFP (n=43). (V) Quantification of hub size: 108±2.393 μm2 in _nos_>H3-GFP (N=50) testes versus 198.5±15.22 μm2 in _nos_>H3T3A-GFP testes (N=37) (***P < 10−4) or 145.2 ± 9.702 μm2 in _nos_>H3T3D-GFP testes (N=37) (***P < 10−4). All ratios= Avg ± SE; P-value calculated by unpaired t test. See also Figure S4 and S5.
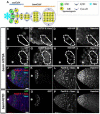
Figure 6. Expression of H3T3A or H3T3D using the bam-Gal4 driver did not phenocopy defects in _nos_>H3T3A or _nos_>H3T3D testes
(A) A cartoon showing stage-specificity of nos-Gal4 and bam-Gal4 drivers: nos-Gal4 is turned on in early-stage germline, including GSCs (Van Doren et al., 1998), while bam-Gal4 expresses from four-cell spermatogonial cells (Cheng et al., 2008; Eun et al., 2014; Schulz et al., 2004). (B-I) Immunostaining using antibodies against the germ cell-specific marker Vasa, H3T3P, and H3S10P in _bam_>H3T3A-GFP testes. Expression of _bam_>H3T3A greatly reduces H3T3P in later stage mitotic spermatogonial cells: a two-cell mitotic spermatogonial cyst (white dotted outline in B-E) without H3T3A-GFP (B) had detectable H3T3P (C) and H3S10P (D), both H3T3P and H3S10P overlapped with DNA signal stained with Hoechst (E). By contrast, a four-cell mitotic spermatogonial cyst (white dotted outline in F-I) with H3T3A-GFP (F) had greatly reduced H3T3P (G) but abundant H3S10P (H), the H3S10P signal overlapped with DNA signal stained with Hoechst (I). The diffusive signal in (C) and (G) came from anti-Vasa, which stains the entire mitotic germ cells because their nuclear envelopes are broken down (Yadlapalli et al., 2011; Yuan et al., 2012). Scale bars: 10 μm. (J-Q) Immunostaining using antibodies against a hub marker FasIII, spectrosome/fusome marker α-Spectrin and Vasa: tip of the testis expressing _bam_>H3T3A-GFP (J-M) or _bam_>H3T3D-GFP (N-Q). Scale bars: 20 μm. Asterisks in (B-I, J-K, N-O): hub. See also Figure S6.
Figure 7. Genetic interactions between haspin gene mutants and mutations of H3T3
(A-L) Immunostaining using antibodies against a hub marker FasIII, spectrosome/fusome marker α-Spectrin and germ cell marker Vasa in larval testes from _nos_>H3T3A (A-D), Df (haspin)/+; _nos_>H3T3A (E-H) or haspinmi09386/+; _nos_>H3T3A (I-L) males at constant 18 °C. Early-stage germline tumor is detected in testes from Df (haspin)/+; _nos_>H3T3A (F and H) or haspinmi09386/+; _nos_>H3T3A (J and L) males, but not in testes from _nos_>H3T3A (B and D) males. Arrowhead in (G) points to enlarged hub area compared to (C). (M) Percentage of testes that are normal or have germline tumor(s) from males of the following genotypes: _nos_>H3T3A (n=18); Df (haspin)/+; _nos_>H3T3A (n=16); and haspinmi09386/+; _nos_>H3T3A (n=19). (N-U) Immunostaining using antibodies against FasIII, α-Spectrin and Vasa in testes from _nos_>H3T3D (N-Q) or Df (haspin)/+; _nos_>H3T3D (R-U) males (siblings from the same crosses) grown at 18°C, shifted to 29°C as newly eclosed flies and kept at 29°C for seven days. Early-stage germline tumor is detected in testes from _nos_>H3T3D males (O and Q), but less severe in testes from _nos_>H3T3D; Df (haspin)/+ males (S and U). Arrowhead in (P) points to enlarged hub area compared to (T). Early-stage germ cells, as determined by _nos_-driven GFP expression (B, F, J, O, S) and nuclear morphology are delineated by the yellow dotted lines in (D, H, L, Q, U). (V) Percentage of testes that have germline tumor(s) or germ cell loss from males with the following genotypes: _nos_>H3T3D (n=17) or Df (haspin)/+, _nos_>H3T3D (n=12). (W) Quantification of hub size: 172.2 ± 14.72 μm2 in _nos_>H3T3D (n=17) testes versus 115.0 ± 9.802 μm2 in Df (haspin)/+, _nos_>H3T3D (n=12) testes (All ratios= Avg ± SE; *P < 0.005, calculated by unpaired t test). Asterisks in (A, E, I, N, R): hub. Scale bars: 20 μm. See also Figure S7.
Comment in
- Histone Marks Direct Chromosome Segregation.
Pirrotta V. Pirrotta V. Cell. 2015 Nov 5;163(4):792-3. doi: 10.1016/j.cell.2015.10.043. Cell. 2015. PMID: 26544931
Similar articles
- Asymmetric distribution of histones during Drosophila male germline stem cell asymmetric divisions.
Tran V, Feng L, Chen X. Tran V, et al. Chromosome Res. 2013 May;21(3):255-69. doi: 10.1007/s10577-013-9356-x. Chromosome Res. 2013. PMID: 23681658 Free PMC article. Review. - A single N-terminal amino acid determines the distinct roles of histones H3 and H3.3 in the Drosophila male germline stem cell lineage.
Chandrasekhara C, Ranjan R, Urban JA, Davis BEM, Ku WL, Snedeker J, Zhao K, Chen X. Chandrasekhara C, et al. PLoS Biol. 2023 May 1;21(5):e3002098. doi: 10.1371/journal.pbio.3002098. eCollection 2023 May. PLoS Biol. 2023. PMID: 37126497 Free PMC article. - Asymmetric division of Drosophila male germline stem cell shows asymmetric histone distribution.
Tran V, Lim C, Xie J, Chen X. Tran V, et al. Science. 2012 Nov 2;338(6107):679-82. doi: 10.1126/science.1226028. Science. 2012. PMID: 23118191 Free PMC article. - Differential condensation of sister chromatids acts with Cdc6 to ensure asynchronous S-phase entry in Drosophila male germline stem cell lineage.
Ranjan R, Snedeker J, Wooten M, Chu C, Bracero S, Mouton T, Chen X. Ranjan R, et al. Dev Cell. 2022 May 9;57(9):1102-1118.e7. doi: 10.1016/j.devcel.2022.04.007. Epub 2022 Apr 27. Dev Cell. 2022. PMID: 35483360 Free PMC article. - Asymmetric Histone Inheritance in Asymmetrically Dividing Stem Cells.
Wooten M, Ranjan R, Chen X. Wooten M, et al. Trends Genet. 2020 Jan;36(1):30-43. doi: 10.1016/j.tig.2019.10.004. Epub 2019 Nov 18. Trends Genet. 2020. PMID: 31753528 Free PMC article. Review.
Cited by
- The Drosophila histone methyltransferase SET1 coordinates multiple signaling pathways in regulating male germline stem cell maintenance and differentiation.
Vidaurre V, Song A, Li T, Ku WL, Zhao K, Qian J, Chen X. Vidaurre V, et al. Development. 2024 Aug 1;151(15):dev202729. doi: 10.1242/dev.202729. Epub 2024 Aug 9. Development. 2024. PMID: 39007366 Free PMC article. - Haspin inhibition delays cell cycle progression through interphase in cancer cells.
Wang P, Hua X, Bryner YH, Liu S, Gitter CB, Dai J. Wang P, et al. J Cell Physiol. 2020 May;235(5):4508-4519. doi: 10.1002/jcp.29328. Epub 2019 Oct 17. J Cell Physiol. 2020. PMID: 31625162 Free PMC article. - Enrichment of Undifferentiated Germline and Somatic Cells from Drosophila Testes.
Ridwan SM, Antel M, Inaba M. Ridwan SM, et al. Methods Mol Biol. 2023;2677:127-138. doi: 10.1007/978-1-0716-3259-8_7. Methods Mol Biol. 2023. PMID: 37464239 - Haspin balances the ratio of asymmetric cell division through Wnt5a and regulates cell fate decisions in mouse embryonic stem cells.
Gao Y, Ma B, Li Y, Wu X, Zhao S, Guo H, Wang Y, Sun L, Xie J. Gao Y, et al. Cell Death Discov. 2023 Aug 23;9(1):307. doi: 10.1038/s41420-023-01604-w. Cell Death Discov. 2023. PMID: 37612272 Free PMC article. - Phosphorylation of H3-Thr3 by Haspin Is Required for Primary Cilia Regulation.
Quadri R, Sertic S, Ghilardi A, Rondelli D, Gallo GR, Del Giacco L, Muzi-Falconi M. Quadri R, et al. Int J Mol Sci. 2021 Jul 20;22(14):7753. doi: 10.3390/ijms22147753. Int J Mol Sci. 2021. PMID: 34299370 Free PMC article.
References
- Betschinger J, Knoblich JA. Dare to be different: asymmetric cell division in Drosophila, C. elegans and vertebrates. Curr Biol. 2004;14:R674–685. - PubMed
- Boyle M, Wong C, Rocha M, Jones DL. Decline in self-renewal factors contributes to aging of the stem cell niche in the Drosophila testis. Cell Stem Cell. 2007;1:470–478. - PubMed
- Caperta AD, Rosa M, Delgado M, Karimi R, Demidov D, Viegas W, Houben A. Distribution patterns of phosphorylated Thr 3 and Thr 32 of histone H3 in plant mitosis and meiosis. Cytogenet Genome Res. 2008;122:73–79. - PubMed
Publication types
MeSH terms
Substances
Grants and funding
- 5T32GM007231/GM/NIGMS NIH HHS/United States
- R01 HD065816/HD/NICHD NIH HHS/United States
- R01 GM112008/GM/NIGMS NIH HHS/United States
- R01HD065816/HD/NICHD NIH HHS/United States
- S10 OD016230/OD/NIH HHS/United States
- R01GM112008/GM/NIGMS NIH HHS/United States
- Howard Hughes Medical Institute/United States
LinkOut - more resources
Full Text Sources
Other Literature Sources
Molecular Biology Databases
Research Materials


