Coordination of m(6)A mRNA Methylation and Gene Transcription by ZFP217 Regulates Pluripotency and Reprogramming - PubMed (original) (raw)
. 2015 Dec 3;17(6):689-704.
doi: 10.1016/j.stem.2015.09.005. Epub 2015 Oct 29.
Fan Zhang 2, Ana Sancho 3, Miguel Fidalgo 4, Serena Di Cecilia 3, Ajay Vashisht 5, Dung-Fang Lee 4, Chih-Hung Chen 3, Madhumitha Rengasamy 6, Blanca Andino 6, Farid Jahouh 7, Angel Roman 8, Sheryl R Krig 9, Rong Wang 10, Weijia Zhang 2, James A Wohlschlegel 5, Jianlong Wang 4, Martin J Walsh 11
Affiliations
- PMID: 26526723
- PMCID: PMC4671830
- DOI: 10.1016/j.stem.2015.09.005
Coordination of m(6)A mRNA Methylation and Gene Transcription by ZFP217 Regulates Pluripotency and Reprogramming
Francesca Aguilo et al. Cell Stem Cell. 2015.
Abstract
Epigenetic and epitranscriptomic networks have important functions in maintaining the pluripotency of embryonic stem cells (ESCs) and somatic cell reprogramming. However, the mechanisms integrating the actions of these distinct networks are only partially understood. Here we show that the chromatin-associated zinc finger protein 217 (ZFP217) coordinates epigenetic and epitranscriptomic regulation. ZFP217 interacts with several epigenetic regulators, activates the transcription of key pluripotency genes, and modulates N6-methyladenosine (m(6)A) deposition on their transcripts by sequestering the enzyme m(6)A methyltransferase-like 3 (METTL3). Consistently, Zfp217 depletion compromises ESC self-renewal and somatic cell reprogramming, globally increases m(6)A RNA levels, and enhances m(6)A modification of the Nanog, Sox2, Klf4, and c-Myc mRNAs, promoting their degradation. ZFP217 binds its own target gene mRNAs, which are also METTL3 associated, and is enriched at promoters of m(6)A-modified transcripts. Collectively, these findings shed light on how a transcription factor can tightly couple gene transcription to m(6)A RNA modification to ensure ESC identity.
Copyright © 2015 Elsevier Inc. All rights reserved.
Figures
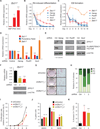
Figure 1. ZFP217 is required to maintain the pluripotent state of ESCs
(A) RT-qPCR analysis of Zfp217 expression in MEFs, iPSCs and ESCs. Data are represented as mean ± SD; n = 3. ***p<0.0005; **p<0.005 versus MEFs. (B and C) RT-qPCR analysis of Zfp217, Pou5f1, Sox2, and Zfp617 during RA-induced differentiation (B) and EB formation (C). Data are represented as mean ± SD; n = 3. (D–E) RT-qPCR analysis of Zfp217 (D) and representative western blot (E) for ZFP217 upon Nanog, Pou5f1 and Sox2 depletion. The expression of the pluripotency factors was determined to monitor the knockdown efficiency. Error bars show ± SD; n = 3. ***p<0.0001 versus control shRNA. For the immunoblots β-ACTIN was used as a loading control. * non specific. (F) RT-qPCR (upper panel) and western blot analysis (lower panel) to monitor Zfp217 knockdown efficiency. Error bars show ± SD; n = 3. ***p<0.0001 versus control shRNA. For the immunoblot, β-ACTIN was used as a loading control. (G–H) AP staining of control and _Zfp217_-depleted ESCs (G). Percentage of ESC colonies were counted and depicted in the graph (H). Undifferentiated (UD); partially differentiated (PD); fully differentiated (FD). (I) Proliferation rate of control and _Zfp217_-depleted ESCs relative to shRNA control at day 8. Error bars show ± SD; n = 3. *p=0.01 versus control shRNA. (J) Cell cycle distribution of control and _Zfp217_-depleted ESCs examined by DNA content index. Error bars show ± SD; n = 3. ns= not significant; *p<0.05 versus control. (K) Percentage of early apoptotic cells in control and _Zfp217_-depleted ESCs defined as Annexin V-positive and 7AAD-negative cells. Error bars show ± SD; n = 3. **p<0.005; ***p<0.001 versus control shRNA.
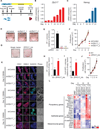
Figure 2. ZFP217 is required for somatic cell reprogramming
(A) Schematics of iPSC generation. (B–C) Representative RT-qPCR analysis for Zfp217 (B) and Nanog (C) during MEF reprogramming. (D–F) AP staining (D) and quantification (E) of control and _Zfp217_-depleted iPSCs at day 21. Error bars show ± SD; n = 3. ***p<0.0001 versus control shRNA. (F) Proliferation rate of control and _Zfp217_-depleted reprogramming MEFs. (G–J) AP staining of reprogramming MEFs overexpressing ZFP217_HA or empty vector at day 15 post-transduction (G). Number of AP+ (H) and GFP+ (I) colonies in ZFP217_HA relative to empty vector. Error bars show ± SD; n = 3. **p<0.001 versus empty vector. (J) Proliferation rate of reprogramming MEFs transduced with ZFP217_HA or empty vector. (K) E-CADHERIN (CDH1), SSEA1 and NANOG immunostaining at indicated days of reprogramming with control or Zfp217 shRNA. Bright field is depicted in the right panel. The scale bar represents 100 µm. (L) Heat map illustrating the relative expression of pluripotency, epithelial and mesenquimal genes measured by RT-qPCR in reprogramming MEFs with control or Zfp217 shRNA at indicated days.
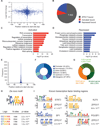
Figure 3. ZFP217 is associated with both promoters and enhancers in ESC
(A) Graph indicating the relative position of the unique closest ZFP217 peaks with respect to the TSS (x-axis) and the log2 fold change in gene expression in response to Zfp217 depletion (y-axis). (B) Pie chart depicting the number of ZFP217 only bound genes, activated and bound, and repressed and bound in _Zfp217_-depleted ESCs. (C–D) Functional categories of genes activated and bound (C) and repressed and bound (D) upon Zfp217 depletion of ESCs showing the p-value for the enrichment of biological process GO-term. (E) Histogram showing the distribution of ZFP217-binding peaks relative to the nearest TSS. (F) Pie chart of the genomic distribution of ZFP217-binding peaks including promoters (within 5 kb upstream of TSS), downstream (within 10 kb downstream of the gene), introns, exons, upstream (within 10 kb upstream of the gene), and intergenic regions. (G) Pie chart depicting ZFP217 binding sites (black lines) at active (green), bivalent (dark green) and silent (orange) genes (defined in Supplemental Experimental Procedures). (H–I) ZFP217 de novo motif (H) and ZFP217 binding at known binding motifs for STAT3, KLF4, SP1 and POU5F1 (I) with the corresponding p-values.
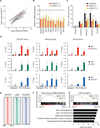
Figure 4. ZFP217 positively regulates the ESC transcriptome
(A) Scatter plot of upregulated and downregulated genes in control compared to _Zfp217_-depleted ESCs. (B) RT-qPCR analysis of pluripotency-associated genes in ESCs transduced with Zfp217_1 or Zfp217_2 compared to control shRNA. Error bars show ± SD; n = 3. *p<0.0001 versus control shRNA. (C) Luciferase assay of the indicated constructs transfected in control or _Zfp217_-depleted ESCs. Data is normalized to CMV-renilla luciferase and represented relative to the minimal Oct4 promoter. Error bars show ± SD; n = 3. **p<0.001; *p<0.05; ns = not significant versus control shRNA. (D) ChIP-qPCR analysis of ZFP217 (upper panel), LSD1 (medium panel) and POU5F1 (lower panel) binding at the Pou5f1, Nanog and Sox2 locus. The positions of the amplified regions are indicated at Figures S3A–C. TSS, transcriptional start site; E1 and E2, enhancer 1 and enhancer 2, respectively. Error bars show ± SD; n = 3. *p<0.0001; ns = not significant versus IgG control. (E) Density maps of ZFP217, LSD1, and POU5F1 ChIP-Seq datasets at TSS. Color scale indicates ChIP-Seq signal in reads per million. (F) GSEA plots of ZFP217, LSD1, and POU5F1-bound genes during RA-induced differentiation and EB formation. High and low expression of genes is represented in red and blue, respectively. NES, normalized enrichment score; FDR, false discovery rate (upper panel). Functional categories of ZFP217, LSD1, and POU5F1-bound genes using GREAT software (lower panel).
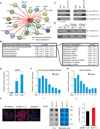
Figure 5. ZFP217 interacts with METTL3 and counteracts its activity
(A) Diagram depicting the network of associated proteins identified through LC-MS/MS of ZFP217. Black and red lines represent published and novel interactions, respectively. (B) IPA analysis of proteins identified with LC-MS/MS. Left box describes the molecular and cellular functions. Right box describes function annotations of the RNA post-transcriptional modification category. (C) Immunoprecipiation of nuclear extracts from ESCs with antibodies against ZFP217 (left panel) or METTL3 (right panel) followed by immunoblotting with ZFP217, METTL3 and METTL14 antibodies. IgG was used as a control. (D) Immunoprecipiation of nuclear extracts pretreated with DNase I or RNase A with antibodies against ZFP217 followed by immunoblotting with ZFP217 and METTL3 antibodies. IgG was used as a control. (E) RT-qPCR analysis of Mettl3 expression in MEFs, iPSCs and ESCs. Error bars show ± SD; n = 3. ***p<0.0005 versus MEFs. (F and G) RT-qPCR analysis of Mettl3 during RA-induced differentiation (F) and EB formation (G). Error bars show ± SD; n = 3 (H) m6A immunostaining of ESCs transduced with control, Zfp217_1, or Mettl3_1 shRNAs. Nuclei were stained with DAPI. The scale bar represents 100 µm (I) Dot blot analysis of polyadenylated RNA (poly(A)+) isolated from control and Zfp217_1 shRNA ESCs. Indicated amounts were loaded and detected with m6A antibody. Methylene blue staining was used as a loading control. (J) LC-MS/MS quantification of the m6A/A ratio in polyadenylated RNA isolated from control and Zfp217_1 knockdown ESCs. Error bars show ± SD; n = 2. *p<0.05 versus control shRNA.
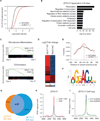
Figure 6. Analysis of ZFP217-dependent m6A sites
(A) Cumulative distribution function of log2 peak intensity of m6A-modified sites in control and _Zfp217_-depleted ESCs. (B) Functional categories of ZFP217-dependent m6A sites. The p-value for the enrichment of biological process GO-term is shown. (C) GSEA plot of ZFP217-dependent m6A sites during RA-induced differentiation (upper panel) and EB formation (lower panel). High and low expression of genes is represented in red and blue, respectively. NES, normalized enrichment score; FDR, false discovery rate. (D) Heat map representing Log2 fold change of Zfp217 shRNA ESCs compared to control (first column) and Mettl3 KO ESCs compared to WT (second column). Red and blue indicate increase and decrease of m6A peak intensity, respectively. (E) Distributions of distance between the m6A peak and the nearest consensus site of control and _Zfp217_-depleted ESCs. (F) Sequence logo representing the consensus motif following clustering of all enriched motifs in ZFP217-dependent peaks. (G) Venn diagram showing the overlapping transcripts of ZFP217 and METTL3 RIP-Seq samples. (H) Diagram depicting the coverage at the TSS of genes containing ChIP and RIP peaks or ChIP peaks only with ZFP217 antibodies. (I) Coverage of ZFP217 signal at the TSS of modified and unmodified genes.
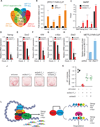
Figure 7. ZFP217 regulates the epitranscriptome of key pluripotency factors
(A) Venn diagram of ZFP217 ChIP-Seq target genes, m6A ZFP217-dependent transcripts, and ZFP217 and METTL3 transcriptomes. (B) RT-qPCR of Nanog, Sox2, Klf4, and c-Myc after PAR-CLIP with ZFP217 specific antibodies. Fold enrichment relative to IgG control. Error bars show ± SD; n = 3. **p<0.01; ***p<0.001 versus IgG control. (C) RT-qPCR of m6A modification at key pluripotency RNAs in control and Zfp217 shRNA. Percentage of input is shown. Error bars show ± SD; n = 3. ***p<0.0001; ns= not significant versus control shRNA. (D–H) RT-qPCR analysis of Nanog (D), Sox2 (E), Klf4 (F), c-Myc (G), and Stat 3 (H) expression after 8 hours of EU incorporation in control and _Zfp217_-depleted ESCs. Error bars show ± SD; n = 2. ***p<0.0001; **p<0.001; *p<0.01; ns= not significant versus control shRNA at 8h. (I) Quantification of the RNA binding ability of METTL3 in control and _Zfp217_-depleted ESCs (from Figure S6E). RNA binding was normalized to the corresponding pull-downed proteins. Error bars show ± SD; n = 2. *p<0.005 versus control shRNA. (J–K) AP staining of reprogramming MEFs transduced with OSKM in the presence of the indicated shRNA constructs at day 15 (J). Number of AP+ colonies relative to control iPSCs (K). Error bars show ± SD; n = 4. ***p<0.0001 versus Zfp217 shRNA. (L) Schematics illustrating ZFP217 function in ESC self-renewal and iPSC reprogramming. In our model, ZFP217 directly regulates transcription of key pluripotency and reprogramming factors, including Nanog, Sox2, Klf4 and c-Myc, and promotes their stabilization by preventing them from METTL3-mediated m6A aberrant methylation.
Similar articles
- m(6)A RNA methylation is regulated by microRNAs and promotes reprogramming to pluripotency.
Chen T, Hao YJ, Zhang Y, Li MM, Wang M, Han W, Wu Y, Lv Y, Hao J, Wang L, Li A, Yang Y, Jin KX, Zhao X, Li Y, Ping XL, Lai WY, Wu LG, Jiang G, Wang HL, Sang L, Wang XJ, Yang YG, Zhou Q. Chen T, et al. Cell Stem Cell. 2015 Mar 5;16(3):289-301. doi: 10.1016/j.stem.2015.01.016. Epub 2015 Feb 12. Cell Stem Cell. 2015. PMID: 25683224 - Reptin regulates pluripotency of embryonic stem cells and somatic cell reprogramming through Oct4-dependent mechanism.
Do EK, Cheon HC, Jang IH, Choi EJ, Heo SC, Kang KT, Bae KH, Cho YS, Seo JK, Yoon JH, Lee TG, Kim JH. Do EK, et al. Stem Cells. 2014 Dec;32(12):3126-36. doi: 10.1002/stem.1827. Stem Cells. 2014. PMID: 25185564 - Gata4 blocks somatic cell reprogramming by directly repressing Nanog.
Serrano F, Calatayud CF, Blazquez M, Torres J, Castell JV, Bort R. Serrano F, et al. Stem Cells. 2013 Jan;31(1):71-82. doi: 10.1002/stem.1272. Stem Cells. 2013. PMID: 23132827 - [The alchemy--epigenetic regulation of pluripotency].
Bem J, Grabowska I. Bem J, et al. Postepy Biochem. 2013;59(2):144-56. Postepy Biochem. 2013. PMID: 24044279 Review. Polish. - Epigenetics in embryonic stem cells: regulation of pluripotency and differentiation.
Atkinson S, Armstrong L. Atkinson S, et al. Cell Tissue Res. 2008 Jan;331(1):23-9. doi: 10.1007/s00441-007-0536-x. Epub 2007 Nov 15. Cell Tissue Res. 2008. PMID: 18004593 Review.
Cited by
- The epitranscriptome in stem cell biology and neural development.
Vissers C, Sinha A, Ming GL, Song H. Vissers C, et al. Neurobiol Dis. 2020 Dec;146:105139. doi: 10.1016/j.nbd.2020.105139. Epub 2020 Oct 13. Neurobiol Dis. 2020. PMID: 33065280 Free PMC article. Review. - Roles of METTL3 in cancer: mechanisms and therapeutic targeting.
Zeng C, Huang W, Li Y, Weng H. Zeng C, et al. J Hematol Oncol. 2020 Aug 27;13(1):117. doi: 10.1186/s13045-020-00951-w. J Hematol Oncol. 2020. PMID: 32854717 Free PMC article. Review. - METTL3 acetylation impedes cancer metastasis via fine-tuning its nuclear and cytosolic functions.
Li Y, He X, Lu X, Gong Z, Li Q, Zhang L, Yang R, Wu C, Huang J, Ding J, He Y, Liu W, Chen C, Cao B, Zhou D, Shi Y, Chen J, Wang C, Zhang S, Zhang J, Ye J, You H. Li Y, et al. Nat Commun. 2022 Oct 26;13(1):6350. doi: 10.1038/s41467-022-34209-5. Nat Commun. 2022. PMID: 36289222 Free PMC article. - Genetic variants of m6A modification genes are associated with survival of HBV-related hepatocellular carcinoma.
Liu S, Li J, Qiu M, Liu Y, Wen Q, Lin Q, Jiang Y, Zhou Z, Liang X, Wei X, Yu H, Chen P. Liu S, et al. J Cell Mol Med. 2024 Aug;28(16):e18517. doi: 10.1111/jcmm.18517. J Cell Mol Med. 2024. PMID: 39163514 Free PMC article. - The Biogenesis and Precise Control of RNA m6A Methylation.
Huang H, Weng H, Chen J. Huang H, et al. Trends Genet. 2020 Jan;36(1):44-52. doi: 10.1016/j.tig.2019.10.011. Epub 2019 Dec 4. Trends Genet. 2020. PMID: 31810533 Free PMC article. Review.
References
- Boiani M, Scholer HR. Regulatory networks in embryo-derived pluripotent stem cells. Nat Rev Mol Cell Biol. 2005;6:872–884. - PubMed
- Bujnicki JM, Feder M, Radlinska M, Blumenthal RM. Structure prediction and phylogenetic analysis of a functionally diverse family of proteins homologous to the MT-A70 subunit of the human mRNA:m(6)A methyltransferase. J Mol Evol. 2002;55:431–444. - PubMed
Publication types
MeSH terms
Substances
Grants and funding
- CA154903/CA/NCI NIH HHS/United States
- R01 GM112763/GM/NIGMS NIH HHS/United States
- R01 HL103967/HL/NHLBI NIH HHS/United States
- R01 GM095942/GM/NIGMS NIH HHS/United States
- R01 CA154809/CA/NCI NIH HHS/United States
- HL103967/HL/NHLBI NIH HHS/United States
- R24 CA088325/CA/NCI NIH HHS/United States
- DA028776/DA/NIDA NIH HHS/United States
- GM089778/GM/NIGMS NIH HHS/United States
- RC1 DA028776/DA/NIDA NIH HHS/United States
- P30 NS061777/NS/NINDS NIH HHS/United States
- R01 GM089778/GM/NIGMS NIH HHS/United States
- 1R01-GM095942/GM/NIGMS NIH HHS/United States
LinkOut - more resources
Full Text Sources
Other Literature Sources
Molecular Biology Databases
Research Materials
