Interferon-α Subtypes in an Ex Vivo Model of Acute HIV-1 Infection: Expression, Potency and Effector Mechanisms - PubMed (original) (raw)
Interferon-α Subtypes in an Ex Vivo Model of Acute HIV-1 Infection: Expression, Potency and Effector Mechanisms
Michael S Harper et al. PLoS Pathog. 2015.
Abstract
HIV-1 is transmitted primarily across mucosal surfaces and rapidly spreads within the intestinal mucosa during acute infection. The type I interferons (IFNs) likely serve as a first line of defense, but the relative expression and antiviral properties of the 12 IFNα subtypes against HIV-1 infection of mucosal tissues remain unknown. Here, we evaluated the expression of all IFNα subtypes in HIV-1-exposed plasmacytoid dendritic cells by next-generation sequencing. We then determined the relative antiviral potency of each IFNα subtype ex vivo using the human intestinal Lamina Propria Aggregate Culture model. IFNα subtype transcripts from the centromeric half of the IFNA gene complex were highly expressed in pDCs following HIV-1 exposure. There was an inverse relationship between IFNA subtype expression and potency. IFNα8, IFNα6 and IFNα14 were the most potent in restricting HIV-1 infection. IFNα2, the clinically-approved subtype, and IFNα1 were both highly expressed but exhibited relatively weak antiviral activity. The relative potencies correlated with binding affinity to the type I IFN receptor and the induction levels of HIV-1 restriction factors Mx2 and Tetherin/BST-2 but not APOBEC3G, F and D. However, despite the lack of APOBEC3 transcriptional induction, the higher relative potency of IFNα8 and IFNα14 correlated with stronger inhibition of virion infectivity, which is linked to deaminase-independent APOBEC3 restriction activity. By contrast, both potent (IFNα8) and weak (IFNα1) subtypes significantly induced HIV-1 GG-to-AG hypermutation. The results unravel non-redundant functions of the IFNα subtypes against HIV-1 infection, with strong implications for HIV-1 mucosal immunity, viral evolution and IFNα-based functional cure strategies.
Conflict of interest statement
The authors have declared that no competing interests exist.
Figures
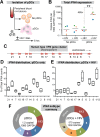
Fig 1. Expression of IFNα subtypes in pDCs following HIV-1 exposure.
(A) Isolation pDCs. pDCs were enriched by negative selection from PBMCs of healthy donors (n = 4). Both pDC-enriched and pDC-negative fractions were exposed to 250 ng p24 of HIV-1BaL by 2 hr spinoculation at room temperature and incubated 4 hr at 37°C. (B) Total copies of IFNA by qPCR normalized to 103 copies GAPDH. Each color/shape combination corresponds to one donor. Data were analyzed using a 2-tailed Student’s paired t-test. **, p<0.01. (C) Type I IFN gene cluster in human chromosome 9. (D, E) Percentage of total IFNA sequence counts for each IFNA subtype in (D) Mock or (E) HIV-1BaL infection. IFNA subtypes on the x-axis were shown relative to chromosomal position. The values for IFNA1/13 were presented at the genomic position for IFNA1. Box-and-whisker plots correspond to 25-75th percentiles with bars corresponding to minimum and maximum values. Median values were indicated as solid lines within the boxes. (F) Relative abundance of the 5 predominant subtypes expressed in pDCs ± HIV-1 exposure.
Fig 2. Inhibition of HIV-1 by 12 IFNα subtypes in the LPAC model.
(A) LPMCs (n = 4 donors) were infected with HIV-1BaL (10 ng p24/106 cells) by spinoculation for 2 hrs. Each IFNα subtype was added individually at 100 pg/ml, and cells were harvested at 4dpi. (B) Dose-response curve of IFNα14 for inhibition of HIV-1 infection (p24+CD3+/CD8- lymphocytes). Vertical dashed line indicates the IFNα dose used for subsequent experiments. Inhibition of (C) cellular HIV-1 infection and (D) infectious titer, normalized to untreated samples. Bars correspond to the means with SEM error bars from 4 LPMC donors. The x-axis was arranged from the least to the most potent IFNα subtype. Repeated measures ANOVA with Dunnett’s multiple comparison test was performed on raw infection values. Pairwise comparisons were each against the no IFNα control. ns, not significant at _p_>0.05; *, p<0.05; **, p<0.01; ***, p<0.001.
Fig 3. Correlation between IFNα antiviral potency and various parameters.
Percent cellular HIV-1 inhibition values relative to no IFNα treatment control were obtained from Fig 2C. (A) Correlation between IFNα potency and absolute IFNA subtype copy numbers, based on multiplying % IFNA distribution in Fig 1D and total IFNA copies in Fig 1B. IFNα subtype potencies were also correlated with non-log-transformed binding affinity (1/KD or KA) to (B) IFNAR-2 and (C) IFNAR-1 based on published data [22]. For all panels, Pearson correlation analysis was performed, with R2 values and _p_-values shown. Best-fit linear regression curves are shown in the correlation was significant (p<0.05).
Fig 4. Correlation between ISG induction and IFNα subtype antiviral potency.
(A) LPMCs (n = 3 donors) were thawed and infected with HIV-1BaL, then treated with 100 pg/ml of weak (gray bars) and potent (black bars) IFNα subtypes. IFNα1, IFNα2, IFNα8 and IFNα14 shown simply as 1, 2, 8 and 14. After 24 hr, CD4+ T cells were negatively selected and RNA extracted for qPCR. ISGs were quantified using Taqman qPCR normalized to GAPDH levels. Mean fold-induction values and SEM error bars for (B) Mx2, (C) Tetherin/BST-2 and (D) A3G relative to no IFNα control (N) are shown for the 3 donors. Data were analyzed using repeated measures ANOVA with Dunnett’s multiple comparison test. Statistical support for differences in fold-induction between IFNα1 and IFNα2, and IFNα2 and IFNα8/14 are shown. ns, not significant at _p_>0.05; *, p<0.05; **, p<0.01; ***, p<0.001.
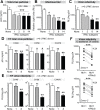
Fig 5. Potent IFNα subtypes inhibit HIV-1 virion infectivity.
LPMCs (n = 6 donors) were infected with HIV-1BaL, treated with IFNα subtypes with weak (gray bars, IFNα1 and IFNα2) or strong (black bars, IFNα8 and IFNα14) antiviral activity. Supernatants at 4 dpi were evaluated for (A) virus particle titer by p24 ELISA, (B) infectious titer by TZM.bl assay and (C) virion infectivity using the ratio of values from (A) and (B). Similar analyses were performed for HIV-1 T/F strains CH40, CH58 and CH470 with IFNα1 and IFNα8, with data on (D) virus particle titer and (e) virion infectivity shown. In (A-E), bars correspond to means with SEM error bars and statistical analyses are shown for comparisons between IFNα-subtype treated samples and no IFNα control (‘none’). Data were analyzed using repeated measures ANOVA with Dunnett’s multiple comparison test. In (E), the data were analyzed using Friedman’s test to account for non-Gaussian distribution, followed by Dunn’s posthoc analysis. (F) Thirteen additional T/F HIV-1 strains (AD17, CH106, CH607, REJO, RHPA, THRO, STCOr1, STCOr2, WARO, MCST, RHGA, TRJO and WITO) were incubated with or without IFNα8 after infecting LPMCs from 2 donors. At 4 dpi, virion infectivities were computed as in (C) and (E). Each connected line corresponds to a T/F HIV-1 strain. Data were analyzed using a 2-tailed paired Student’s t-test. For all panels, ns, not significant at _p_>0.05; *, p<0.05; **, p<0.01; ***, p<0.001.
Fig 6. Potent and weak IFNα subtypes enhanced APOBEC3-mediated hypermutation against multiple HIV-1 strains.
G-to-A mutation rates were estimated for (A) HIV-1 NL4-3 WT versus ΔVif infected LPMCs at 4 dpi; T/F strains infected LPMCs with or without (B) IFNα8 or (C) IFNα1 (100 pg/ml) treatment at 4 dpi. For all panels, DNA was extracted from HIV-1 infected cells or tissues and a 420–450 bp HIV-1 gp41/nef region was amplified using barcoded Illumina primers. Each sequence analyzed was represented at least twice per donor. Sequence reads from multiple donors were pooled for each virus condition. The number of sequence reads analyzed was shown in parentheses. The percentage of the respective mutations relative to the total number of C or G mutations were shown, and the fold-increase relative to the (A) WT or (B, C) no-treatment control were shown in bold. Differences in the proportions of GG→AG or GG→AA mutations relative to other C or G mutations between the treatment groups were analyzed using a 2×2 contingency test with Yates’ correction.
Similar articles
- IFNα Subtypes in HIV Infection and Immunity.
Karakoese Z, Ingola M, Sitek B, Dittmer U, Sutter K. Karakoese Z, et al. Viruses. 2024 Feb 27;16(3):364. doi: 10.3390/v16030364. Viruses. 2024. PMID: 38543729 Free PMC article. Review. - TLR-4 engagement of dendritic cells confers a BST-2/tetherin-mediated restriction of HIV-1 infection to CD4+ T cells across the virological synapse.
Blanchet FP, Stalder R, Czubala M, Lehmann M, Rio L, Mangeat B, Piguet V. Blanchet FP, et al. Retrovirology. 2013 Jan 11;10:6. doi: 10.1186/1742-4690-10-6. Retrovirology. 2013. PMID: 23311681 Free PMC article. - Relative resistance of HIV-1 founder viruses to control by interferon-alpha.
Fenton-May AE, Dibben O, Emmerich T, Ding H, Pfafferott K, Aasa-Chapman MM, Pellegrino P, Williams I, Cohen MS, Gao F, Shaw GM, Hahn BH, Ochsenbauer C, Kappes JC, Borrow P. Fenton-May AE, et al. Retrovirology. 2013 Dec 3;10:146. doi: 10.1186/1742-4690-10-146. Retrovirology. 2013. PMID: 24299076 Free PMC article. - Qualitative Differences Between the IFNα subtypes and IFNβ Influence Chronic Mucosal HIV-1 Pathogenesis.
Guo K, Shen G, Kibbie J, Gonzalez T, Dillon SM, Smith HA, Cooper EH, Lavender K, Hasenkrug KJ, Sutter K, Dittmer U, Kroehl M, Kechris K, Wilson CC, Santiago ML. Guo K, et al. PLoS Pathog. 2020 Oct 16;16(10):e1008986. doi: 10.1371/journal.ppat.1008986. eCollection 2020 Oct. PLoS Pathog. 2020. PMID: 33064743 Free PMC article. - Interferon α subtypes in HIV infection.
Sutter K, Dickow J, Dittmer U. Sutter K, et al. Cytokine Growth Factor Rev. 2018 Apr;40:13-18. doi: 10.1016/j.cytogfr.2018.02.002. Epub 2018 Feb 13. Cytokine Growth Factor Rev. 2018. PMID: 29475588 Review.
Cited by
- Interferon-Regulated Expression of Cellular Splicing Factors Modulates Multiple Levels of HIV-1 Gene Expression and Replication.
Roesmann F, Müller L, Klaassen K, Heß S, Widera M. Roesmann F, et al. Viruses. 2024 Jun 11;16(6):938. doi: 10.3390/v16060938. Viruses. 2024. PMID: 38932230 Free PMC article. Review. - Innate protection against intrarectal SIV acquisition by a live SHIV vaccine.
Sui Y, Meyer TJ, Fennessey CM, Keele BF, Dadkhah K, Ma C, LaBranche CC, Breed MW, Kramer JA, Li J, Howe SE, Ferrari G, Williams LD, Cam M, Kelly MC, Shen X, Tomaras GD, Montefiori D, Greten TF, Miller CJ, Berzofsky JA. Sui Y, et al. JCI Insight. 2024 May 21;9(12):e175800. doi: 10.1172/jci.insight.175800. JCI Insight. 2024. PMID: 38912579 Free PMC article. - IFNα Subtypes in HIV Infection and Immunity.
Karakoese Z, Ingola M, Sitek B, Dittmer U, Sutter K. Karakoese Z, et al. Viruses. 2024 Feb 27;16(3):364. doi: 10.3390/v16030364. Viruses. 2024. PMID: 38543729 Free PMC article. Review. - Towards unravelling biological mechanisms behind radiation-induced oral mucositis via mass spectrometry-based proteomics.
Subedi P, Huber K, Sterr C, Dietz A, Strasser L, Kaestle F, Hauck SM, Duchrow L, Aldrian C, Monroy Ordonez EB, Luka B, Thomsen AR, Henke M, Gomolka M, Rößler U, Azimzadeh O, Moertl S, Hornhardt S. Subedi P, et al. Front Oncol. 2023 Jun 13;13:1180642. doi: 10.3389/fonc.2023.1180642. eCollection 2023. Front Oncol. 2023. PMID: 37384298 Free PMC article. - Several cell-intrinsic effectors drive type I interferon-mediated restriction of HIV-1 in primary CD4+ T cells.
Itell HL, Humes D, Overbaugh J. Itell HL, et al. Cell Rep. 2023 Jun 27;42(6):112556. doi: 10.1016/j.celrep.2023.112556. Epub 2023 May 23. Cell Rep. 2023. PMID: 37227817 Free PMC article.
References
- Pestka S (2007) The interferons: 50 years after their discovery, there is much more to learn. J Biol Chem 282: 20047–20051. - PubMed
- Lane HC, Kovacs JA, Feinberg J, Herpin B, Davey V, et al. (1988) Anti-retroviral effects of interferon-alpha in AIDS-associated Kaposi's sarcoma. Lancet 2: 1218–1222. - PubMed
- Hatzakis A, Gargalianos P, Kiosses V, Lazanas M, Sypsa V, et al. (2001) Low-dose IFN-alpha monotherapy in treatment-naive individuals with HIV-1 infection: evidence of potent suppression of viral replication. J Interferon Cytokine Res 21: 861–869. - PubMed
Publication types
MeSH terms
Substances
Grants and funding
- R01 AI108404/AI/NIAID NIH HHS/United States
- ImNIH/Intramural NIH HHS/United States
- R56 AI116271/AI/NIAID NIH HHS/United States
- T32 GM008497/GM/NIGMS NIH HHS/United States
- R01 AI134220/AI/NIAID NIH HHS/United States
LinkOut - more resources
Full Text Sources
Other Literature Sources
Medical


