Structural and Functional Brain Connectivity of People with Obesity and Prediction of Body Mass Index Using Connectivity - PubMed (original) (raw)
Comparative Study
Structural and Functional Brain Connectivity of People with Obesity and Prediction of Body Mass Index Using Connectivity
Bo-yong Park et al. PLoS One. 2015.
Abstract
Obesity is a medical condition affecting billions of people. Various neuroimaging methods including magnetic resonance imaging (MRI) have been used to obtain information about obesity. We adopted a multi-modal approach combining diffusion tensor imaging (DTI) and resting state functional MRI (rs-fMRI) to incorporate complementary information and thus better investigate the brains of non-healthy weight subjects. The objective of this study was to explore multi-modal neuroimaging and use it to predict a practical clinical score, body mass index (BMI). Connectivity analysis was applied to DTI and rs-fMRI. Significant regions and associated imaging features were identified based on group-wise differences between healthy weight and non-healthy weight subjects. Six DTI-driven connections and 10 rs-fMRI-driven connectivities were identified. DTI-driven connections better reflected group-wise differences than did rs-fMRI-driven connectivity. We predicted BMI values using multi-modal imaging features in a partial least-square regression framework (percent error 15.0%). Our study identified brain regions and imaging features that can adequately explain BMI. We identified potentially good imaging biomarker candidates for obesity-related diseases.
Conflict of interest statement
Competing Interests: The authors have declared that no competing interests exist.
Figures
Fig 1
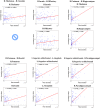
(A) Structural (fiber density) connections with significant group-wise differences. (B) Structural (fiber density) connections that showed significant correlations with fMRI. Green dots and lines represent nodes and edges showing the most significant correlation between structural and functional connectivity, respectively.
Fig 2. Correlation between structural and functional connectivity of various regions.
Six connections with significant correlations between structural and functional connections are reported.
Fig 3. Linear regression results between structural and functional features of different regions that best explained BMI.
Fig 4. Comparison of actual and predicted BMI between HW and non-HW subjects.
Similar articles
- Patterns of brain structural connectivity differentiate normal weight from overweight subjects.
Gupta A, Mayer EA, Sanmiguel CP, Van Horn JD, Woodworth D, Ellingson BM, Fling C, Love A, Tillisch K, Labus JS. Gupta A, et al. Neuroimage Clin. 2015 Jan 13;7:506-17. doi: 10.1016/j.nicl.2015.01.005. eCollection 2015. Neuroimage Clin. 2015. PMID: 25737959 Free PMC article. - Spatially guided functional correlation tensor: A new method to associate body mass index and white matter neuroimaging.
Byeon K, Park BY, Park H. Byeon K, et al. Comput Biol Med. 2019 Apr;107:137-144. doi: 10.1016/j.compbiomed.2019.02.010. Epub 2019 Feb 19. Comput Biol Med. 2019. PMID: 30807908 - White matter damage and brain network alterations in concussed patients: a review of recent diffusion tensor imaging and resting-state functional connectivity data.
Chong CD, Schwedt TJ. Chong CD, et al. Curr Pain Headache Rep. 2015 May;19(5):485. doi: 10.1007/s11916-015-0485-0. Curr Pain Headache Rep. 2015. PMID: 25795157 Review. - Fiber-centered analysis of brain connectivities using DTI and resting state FMRI data.
Lv J, Guo L, Hu X, Zhang T, Li K, Zhang D, Yang J, Liu T. Lv J, et al. Med Image Comput Comput Assist Interv. 2010;13(Pt 2):143-50. doi: 10.1007/978-3-642-15745-5_18. Med Image Comput Comput Assist Interv. 2010. PMID: 20879309 - Topological principles and developmental algorithms might refine diffusion tractography.
Innocenti GM, Dyrby TB, Girard G, St-Onge E, Thiran JP, Daducci A, Descoteaux M. Innocenti GM, et al. Brain Struct Funct. 2019 Jan;224(1):1-8. doi: 10.1007/s00429-018-1759-1. Epub 2018 Sep 27. Brain Struct Funct. 2019. PMID: 30264235 Free PMC article. Review.
Cited by
- Sex-specific alterations in functional connectivity and network topology in patients with degenerative cervical myelopathy.
Oughourlian TC, Rizvi S, Wang C, Kostiuk A, Salamon N, Holly LT, Ellingson BM. Oughourlian TC, et al. Sci Rep. 2024 Jul 11;14(1):16020. doi: 10.1038/s41598-024-67084-9. Sci Rep. 2024. PMID: 38992236 Free PMC article. - Comparison of local activation, functional connectivity, and structural connectivity in the N-back task.
Satake T, Taki A, Kasahara K, Yoshimaru D, Tsurugizawa T. Satake T, et al. Front Neurosci. 2024 Mar 4;18:1337976. doi: 10.3389/fnins.2024.1337976. eCollection 2024. Front Neurosci. 2024. PMID: 38516310 Free PMC article. - Identifying subgroups of eating behavior traits unrelated to obesity using functional connectivity and feature representation learning.
Choi H, Byeon K, Lee JE, Hong SJ, Park BY, Park H. Choi H, et al. Hum Brain Mapp. 2024 Jan;45(1):e26581. doi: 10.1002/hbm.26581. Hum Brain Mapp. 2024. PMID: 38224537 Free PMC article. - Integrated multi-modal brain signatures predict sex-specific obesity status.
Bhatt RR, Todorov S, Sood R, Ravichandran S, Kilpatrick LA, Peng N, Liu C, Vora PP, Jahanshad N, Gupta A. Bhatt RR, et al. Brain Commun. 2023 Apr 4;5(2):fcad098. doi: 10.1093/braincomms/fcad098. eCollection 2023. Brain Commun. 2023. PMID: 37091587 Free PMC article. - Excess BMI in early adolescence adversely impacts maturating functional circuits supporting high-level cognition and their structural correlates.
Brooks SJ, Smith C, Stamoulis C. Brooks SJ, et al. Int J Obes (Lond). 2023 Jul;47(7):590-605. doi: 10.1038/s41366-023-01303-7. Epub 2023 Apr 3. Int J Obes (Lond). 2023. PMID: 37012426
References
- World Health Organization: Obesity and overweight. 2015.
Publication types
MeSH terms
LinkOut - more resources
Full Text Sources
Other Literature Sources
Medical


