Measuring In Vivo Mitophagy - PubMed (original) (raw)
Measuring In Vivo Mitophagy
Nuo Sun et al. Mol Cell. 2015.
Abstract
Alterations in mitophagy have been increasingly linked to aging and age-related diseases. There are, however, no convenient methods to analyze mitophagy in vivo. Here, we describe a transgenic mouse model in which we expressed a mitochondrial-targeted form of the fluorescent reporter Keima (mt-Keima). Keima is a coral-derived protein that exhibits both pH-dependent excitation and resistance to lysosomal proteases. Comparison of a wide range of primary cells and tissues generated from the mt-Keima mouse revealed significant variations in basal mitophagy. In addition, we have employed the mt-Keima mice to analyze how mitophagy is altered by conditions including diet, oxygen availability, Huntingtin transgene expression, the absence of macroautophagy (ATG5 or ATG7 expression), an increase in mitochondrial mutational load, the presence of metastatic tumors, and normal aging. The ability to assess mitophagy under a host of varying environmental and genetic perturbations suggests that the mt-Keima mouse should be a valuable resource.
Copyright © 2015 Elsevier Inc. All rights reserved.
Figures
Figure 1
Detection of in vitro mitophagy using mt-Keima. A) HeLa cells expressing mt-Keima were permeabilized and equilibrated with buffers at pH 4 and pH 7. Levels of green and red signals are shown as a function of cellular pH. Scale bar=10 μm. B) mt-Keima demonstrates a greater than 7-fold change in ratiometric fluorescence over three pH units. Values are normalized to the red/green signal at pH 7 (n=3 per condition, **p<0.01). C) Representative confocal images of HeLa cells expressing mt-Keima in a normoxic environment (21% oxygen) or after 24 hours of hypoxia (1% oxygen). Scale bar=10 μm. D) Representative FACS analysis of hypoxia-induced mitophagy using red-to-green fluorescence. E) Time lapse analysis of a HeLa cell line expressing YFP-Parkin and mt-Keima treated with FCCP/oligomycin (5 μM each). Parkin appears to be recruited to the mitochondria rapidly after FCCP/oligomycin addition and an increase in mitophagy (red fluorescence) begins roughly 15 minutes after Parkin recruitment. After 18 hours, nearly all the green mt-Keima and YFP-Parkin fluorescence has vanished, with cells now exhibiting predominantly red mt-Keima fluorescence.
Figure 2
The mt-Keima mouse allows for detection of in vivo mitophagy. A) Confocal images of overlayed red and green fluorescence in MEFs expressing mt-Keima. Green structures are consistent with tubular mitochondria and differ morphologically from the red punctate structures. B) Red fluorescence only from this image. C) Lysosomal staining using LysoSensor (depicted in cyan). D) Magnified image demonstrating red mt-Keima signal is wholly contained within lysosomes. Scale bar=10 μm. E) Representative confocal images showing superimposed red/green signals in the liver of mt-Keima mouse. Scale bar=10 μm. F) Red signal only from this image representing mitochondria within the acidic compartment of hepatocytes and G) dextran cascade blue fluorescence that labels the late endosomal/lysosomal compartment within hepatocytes. H) Overlay of red mt-keima and dextran blue fluorescence demonstrating that in vivo the red mt-Keima signal co-localizes with the hepatic lysosomal compartment. I) Levels of mitophagy in embryonic cortex (E15.5) of wild type (Atg7+/+) mice. J) mt-Keima signal in the cortex of an Atg7−/− littermate. Scale bar=10 μm. K) Relative mt-Keima signal in WT or Atg7−/− (E14.5-E18.5) cortex. Values are normalized to WT levels of mitophagy (n=5 per genotype, **p<0.005).
Figure 3
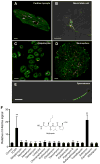
Assessment of mitophagy in primary cells derived from the mt-Keima mouse. A) Mitophagy levels in an adult cardiomyocyte (scale bar=10 μm), B) isolated embryonic neural stem cell (Scale bar=10 μm), C) hepatocytes (scale bar=50 μm), D) a neurosphere derived from embryonic neural stem cells (Scale bar=20 μm) and E) an isolated spermatozoa (scale bar=10 μm). F) Small targeted chemical screen treating embryonic neural stem cells expressing mt-Keima with various antibiotics (each at 100 μM concentration). Twenty-four hours after antibiotic exposure, cells expressing mt-Keima were analyzed by FACS. The antibiotic actinonin (structure shown in inset) functions as an inducer of mitophagy. The chemical uncoupler FCCP (2 μM) was used as a positive control. **p<0.01 compared to control.
Figure 4
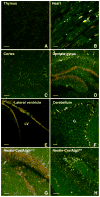
Mitophagy varies between and within tissues. A) Assessment of basal mitophagy in the thymus (scale bar=50 μm) and B) heart (scale bar=10 μm). C) Level of mitophagy in the mouse cortex (scale bar=50 μm), D) the dentate gyrus region (scale bar=100 μm) and E) the lateral ventricle (LV; scale bar=50 μm). F) High rates of mitophagy is observed in the Purkinje (labeled P) cell layer of the cerebellum with less mitophagy evident in the granular (labeled G) layer (scale bar=50 μm). G) Representative confocal images showing levels of mitophagy in the dentate gyrus region of a four week old control mouse (Nestin-Cre+/Atg5WT/WT) versus H) a littermate lacking neuronal ATG5 expression (Nestin-Cre+/Atg5fl/fl; scale bar=50 μm).
Figure 5
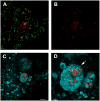
Assessment of mitophagy using mt-Keima and Stimulated Emission Depletion (STED) microscopy. A) Representative STED image of mt-Keima MEFs showing merged red and green fluorescence. B) The red only mt-Keima signal. C) Merged red mt-Keima signal with LysoSensor fluorescence (depicted in Cyan; scale bar=2 μm). D) Higher magnification of the mt-Keima red signal within lysosomes. Arrows indicate what appears to be a recently ingested autophagosome decorated with mt-Keima and contained within a presumed newly formed autolysosome (scale bar=1 μm).
Figure 6
Assessment of mitophagy in the dentate gyrus region and the effects of age and HTT expression. A) Levels of mitophagy in the dentate gyrus region of a three month old mt-Keima mouse (scale bar=50 μm). B) Similar analysis of a 21 month animal. C) Corresponding DAPI fluorescence in the same young and D) old mouse. E) Quantification of mt-Keima fluorescence in young (2–3 months) and old (21–23 months) mice. (n=5 per age group, **p<0.005). F) Representative confocal image of mitophagy in the dentate gyrus region of a 24 week old WT control mt-Keima mouse or G) in a similar aged mt-Keima mouse expressing the HTT transgene. H) Corresponding DAPI staining in the control animal or I) the HTT expressing animal. J) Quantification of the mt-Keima in control or HTT expressing animals. (n=5 per genotype, **p<0.005).
Figure 7
Hepatic mitophagy is sensitive to environmental and genetic perturbations. A) mt-Keima signal in the liver of mice fed a normal chow (NC) diet or fed a high fat diet (HFD; scale bar=20 μm) for 18 weeks with corresponding lipid staining (Oil Red O) in the lower panels (scale bar=100 μm). B) Quantification of the decline in mitophagy induced by a high fat diet (n=5 per diet, **p<0.005). C) Levels of mitophagy in liver of mice maintained under normoxic conditions (21% oxygen) versus mice maintained in 10% oxygen for 10 days (Scale bar=50 μm). D) Quantification of the increase in mitophagy in livers after hypoxic stress (n=4 per condition, **p<0.01). E) Levels of mitophagy in control mice or mice containing a knockin mutation of mitochondrial polymerase γ that lacks proof reading function (POLG; scale bar=50 μm). F) Quantification of mitophagy in the control and POLG mice (n=6 per genotype, **p<0.005). G) Levels of hepatic mitophagy in control mice or mice who received a tail vein injection of B16 murine melanoma cells (scale bar=50 μm). Gross examination of the liver revealed no evidence of tumors that were however readily apparent in the lungs of these animals. H) Quantification of hepatic mitophagy in control or B16 melanoma-injected mice (n=6 per condition, **p<0.005).
Similar articles
- A fluorescence-based imaging method to measure in vitro and in vivo mitophagy using mt-Keima.
Sun N, Malide D, Liu J, Rovira II, Combs CA, Finkel T. Sun N, et al. Nat Protoc. 2017 Aug;12(8):1576-1587. doi: 10.1038/nprot.2017.060. Epub 2017 Jul 13. Nat Protoc. 2017. PMID: 28703790 - Methods for Monitoring Mitophagy Using mt-Keima.
Gilsrud AJ, Narendra DP. Gilsrud AJ, et al. Methods Mol Biol. 2024;2845:151-160. doi: 10.1007/978-1-0716-4067-8_12. Methods Mol Biol. 2024. PMID: 39115664 - Detection of Iron Depletion- and Hypoxia-Induced Mitophagy in Mammalian Cells.
Yamashita SI, Kanki T. Yamashita SI, et al. Methods Mol Biol. 2018;1782:315-324. doi: 10.1007/978-1-4939-7831-1_18. Methods Mol Biol. 2018. PMID: 29851008 - New methods for monitoring mitochondrial biogenesis and mitophagy in vitro and in vivo.
Williams JA, Zhao K, Jin S, Ding WX. Williams JA, et al. Exp Biol Med (Maywood). 2017 Apr;242(8):781-787. doi: 10.1177/1535370216688802. Epub 2017 Jan 1. Exp Biol Med (Maywood). 2017. PMID: 28093935 Free PMC article. Review. - Roles of mitophagy in cellular physiology and development.
Dengjel J, Abeliovich H. Dengjel J, et al. Cell Tissue Res. 2017 Jan;367(1):95-109. doi: 10.1007/s00441-016-2472-0. Epub 2016 Aug 3. Cell Tissue Res. 2017. PMID: 27488107 Review.
Cited by
- Energy metabolism design of the striated muscle cell.
Glancy B, Balaban RS. Glancy B, et al. Physiol Rev. 2021 Oct 1;101(4):1561-1607. doi: 10.1152/physrev.00040.2020. Epub 2021 Mar 18. Physiol Rev. 2021. PMID: 33733879 Free PMC article. Review. - Selective autophagy as a therapeutic target for neurological diseases.
Xu W, Ocak U, Gao L, Tu S, Lenahan CJ, Zhang J, Shao A. Xu W, et al. Cell Mol Life Sci. 2021 Feb;78(4):1369-1392. doi: 10.1007/s00018-020-03667-9. Epub 2020 Oct 16. Cell Mol Life Sci. 2021. PMID: 33067655 Free PMC article. Review. - Liver-specific Prkn knockout mice are more susceptible to diet-induced hepatic steatosis and insulin resistance.
Edmunds LR, Xie B, Mills AM, Huckestein BR, Undamatla R, Murali A, Pangburn MM, Martin J, Sipula I, Kaufman BA, Scott I, Jurczak MJ. Edmunds LR, et al. Mol Metab. 2020 Nov;41:101051. doi: 10.1016/j.molmet.2020.101051. Epub 2020 Jul 10. Mol Metab. 2020. PMID: 32653576 Free PMC article. - A Glimmer of Hope: Maintain Mitochondrial Homeostasis to Mitigate Alzheimer's Disease.
Li W, Kui L, Demetrios T, Gong X, Tang M. Li W, et al. Aging Dis. 2020 Oct 1;11(5):1260-1275. doi: 10.14336/AD.2020.0105. eCollection 2020 Oct. Aging Dis. 2020. PMID: 33014536 Free PMC article. Review. - Mitophagy in human health, ageing and disease.
Picca A, Faitg J, Auwerx J, Ferrucci L, D'Amico D. Picca A, et al. Nat Metab. 2023 Dec;5(12):2047-2061. doi: 10.1038/s42255-023-00930-8. Epub 2023 Nov 30. Nat Metab. 2023. PMID: 38036770 Review.
References
- Balaban RS, Nemoto S, Finkel T. Mitochondria, oxidants, and aging. Cell. 2005;120:483–495. - PubMed
- Bingol B, Tea JS, Phu L, Reichelt M, Bakalarski CE, Song Q, Foreman O, Kirkpatrick DS, Sheng M. The mitochondrial deubiquitinase USP30 opposes parkin-mediated mitophagy. Nature. 2014;510:370–375. - PubMed
- Burte F, Carelli V, Chinnery PF, Yu-Wai-Man P. Disturbed mitochondrial dynamics and neurodegenerative disorders. Nat Rev Neurol. 2015;11:11–24. - PubMed
Publication types
MeSH terms
Substances
LinkOut - more resources
Full Text Sources
Other Literature Sources
Molecular Biology Databases


