INTEGRATE: gene fusion discovery using whole genome and transcriptome data - PubMed (original) (raw)
INTEGRATE: gene fusion discovery using whole genome and transcriptome data
Jin Zhang et al. Genome Res. 2016 Jan.
Abstract
While next-generation sequencing (NGS) has become the primary technology for discovering gene fusions, we are still faced with the challenge of ensuring that causative mutations are not missed while minimizing false positives. Currently, there are many computational tools that predict structural variations (SV) and gene fusions using whole genome (WGS) and transcriptome sequencing (RNA-seq) data separately. However, as both WGS and RNA-seq have their limitations when used independently, we hypothesize that the orthogonal validation from integrating both data could generate a sensitive and specific approach for detecting high-confidence gene fusion predictions. Fortunately, decreasing NGS costs have resulted in a growing quantity of patients with both data available. Therefore, we developed a gene fusion discovery tool, INTEGRATE, that leverages both RNA-seq and WGS data to reconstruct gene fusion junctions and genomic breakpoints by split-read mapping. To evaluate INTEGRATE, we compared it with eight additional gene fusion discovery tools using the well-characterized breast cell line HCC1395 and peripheral blood lymphocytes derived from the same patient (HCC1395BL). The predictions subsequently underwent a targeted validation leading to the discovery of 131 novel fusions in addition to the seven previously reported fusions. Overall, INTEGRATE only missed six out of the 138 validated fusions and had the highest accuracy of the nine tools evaluated. Additionally, we applied INTEGRATE to 62 breast cancer patients from The Cancer Genome Atlas (TCGA) and found multiple recurrent gene fusions including a subset involving estrogen receptor. Taken together, INTEGRATE is a highly sensitive and accurate tool that is freely available for academic use.
© 2016 Zhang et al.; Published by Cold Spring Harbor Laboratory Press.
Figures
Figure 1.
Overview of INTEGRATE. (A) INTEGRATE establishes a gene fusion graph using encompassing RNA-seq reads (black lines) to connect nodes or genes (blue rectangles). Edges of the fusion graph are removed following various filtering steps before undergoing a targeted split-read alignment involving the remaining edges. Encompassing and spanning split-read realignment and mapping are performed on BWTs of gene nodes (Supplemental Fig. 1). Encompassing WGS reads are retrieved from regions determined by spanning RNA-seq reads. Spanning WGS reads are aligned to the regions indicated by encompassing WGS reads (steps indicated by green and purple arrows; also see B). (B) When encompassing (black) and spanning (red) RNA-seq reads have been mapped to the genes involved in a gene fusion, the encompassing WGS reads (green) are expected from focal encompassing WGS regions (green area) bounded by maximum insert size upstream of or downstream from the fusion junctions of the transcripts. The spanning WGS reads (purple) are expected to align within focal WGS regions (orange area) bounded by fusion junction and maximum insert size downstream from the encompassing WGS reads.
Figure 2.
Gene fusion validation. Targeted cDNA-capture validation was attempted for 240 gene fusion candidates called by INTEGRATE and eight additional gene fusion detection methods, resulting in the validation of 138 gene fusions. Gene fusion candidates nominated by INTEGRATE using default parameters and a threshold of one encompassing RNA-seq read (1-En) are shown on the left, whereas candidates nominated by eight additional programs, and not INTEGRATE (“non-INTEGRATE”), are shown on the right. See Supplemental Figure 2 for tiers of INTEGRATE. In each category, gene fusion candidates are further divided into rearrangement classes: inter-chromosomal (blue shade) and intra-chromosomal (yellow shade), and sorted in descending order of total RNA-seq read support (dark red bar—encompassing RNA-seq reads; green bar—spanning RNA-seq reads). Previously reported gene fusions are written at the top of the bars. In the lower panel, each row corresponds to the gene fusion candidates nominated by each program. INTEGRATE, Comrad, BreakTrans, and nFuse use both RNA-seq and WGS data. INTEGRATE is shown using the RNA-seq alignments from GSNAP, TopHat2, and STAR, separately. ChimeraScan, Tophat-Fusion, FusionCatcher, pyPRADA, and TRUP use only RNA-seq data. Red boxes indicate nominated gene fusions that were experimentally validated, black boxes indicate nominated gene fusions that did not have validation read support, and the lack of a red or black box indicates an algorithm did not nominate the gene fusion candidate.
Figure 3.
Comparison of INTEGRATE and eight additional fusion calling methods. Sensitivity and precision (red bar and blue bar, respectively) of each method were calculated using a gold standard, which is the experimentally validated gene fusion called by nine methods, sorted in decreasing order of sensitivity. INTEGRATE applied with default parameters, using aligned reads generated by GSNAP, TopHat2, and STAR is indicated by G, T, and S, respectively. The combination of the three alignment tools is indicated by C. The accuracy, or F1 score, based on the combination of sensitivity and precision is shown with a green triangle.
Figure 4.
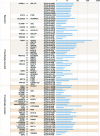
Recurrent and functionally recurrent gene fusions in a TCGA 62 breast cancer patient cohort. Gene fusions are listed in the order of recurrent, 5′ functionally recurrent, and 3′ functionally recurrent. The first column shows the 5′ genes and the second column shows the 3′ genes. The third column is the TCGA names of the samples. Bar chart in the fourth column shows the log scale value of the quantity of supporting RNA-seq reads for each gene fusion.
Figure 5.
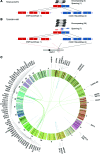
Hotspots of gene fusions in 62 TCGA breast cancer patients. (A) ESR1-CCDC170 fusion in TCGA-A2-A0YG. (B) ESR1-CCDC170 fusion in TCGA-BH-A18R. ESR1 (red) and CCDC170 (blue) are on the forward strand in region 6q25.1, and the 5′ gene ESR1 is downstream from the 3′ gene CCDC170. The two fusions share the same 5′ exon at ESR1 (Exon 2 of transcript uc031sqe.1), but 3′ exons of CCDC170 are different (Exons 2 and 3 of transcript uc003qol.3). (C) Circos plot of recurrent and functionally recurrent gene fusions detected by INTEGRATE. The green lines indicate inter-chromosomal gene fusions, and the blue lines indicate intra-chromosomal gene fusions. The names of the genes involved in each fusion are plotted on the outside of the circle. The gene fusions associate with several hotspots on Chromosomes 1, 11, and 17.
Figure 6.
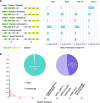
Different patterns between gene fusions and read-throughs. (A) Exons involved in gene fusions and read-throughs follow different patterns. A gene fusion (or read-through) transcript can be categorized into six classes involving the first, second to last, or any other exon of the 5′ gene with either the second or downstream exon of the 3′ gene. (B) Recurrence of gene fusions and read-throughs across 62 breast cancer patients. The horizontal axis is number of patients, and the vertical axis is fraction of events. Blue bars represent gene fusions and red bars represent read-throughs. The pie chart shows the percentage of singleton gene fusions (left) and read-throughs (right).
Similar articles
- Gene Fusion Discovery with INTEGRATE.
Zhang J, Maher CA. Zhang J, et al. Methods Mol Biol. 2020;2079:41-68. doi: 10.1007/978-1-4939-9904-0_4. Methods Mol Biol. 2020. PMID: 31728961 - Systematic discovery of gene fusions in pediatric cancer by integrating RNA-seq and WGS.
van Belzen IAEM, Cai C, van Tuil M, Badloe S, Strengman E, Janse A, Verwiel ETP, van der Leest DFM, Kester L, Molenaar JJ, Meijerink J, Drost J, Peng WC, Kerstens HHD, Tops BBJ, Holstege FCP, Kemmeren P, Hehir-Kwa JY. van Belzen IAEM, et al. BMC Cancer. 2023 Jul 3;23(1):618. doi: 10.1186/s12885-023-11054-3. BMC Cancer. 2023. PMID: 37400763 Free PMC article. - FuGePrior: A novel gene fusion prioritization algorithm based on accurate fusion structure analysis in cancer RNA-seq samples.
Paciello G, Ficarra E. Paciello G, et al. BMC Bioinformatics. 2017 Jan 23;18(1):58. doi: 10.1186/s12859-016-1450-6. BMC Bioinformatics. 2017. PMID: 28114882 Free PMC article. - Recurrent and pathological gene fusions in breast cancer: current advances in genomic discovery and clinical implications.
Veeraraghavan J, Ma J, Hu Y, Wang XS. Veeraraghavan J, et al. Breast Cancer Res Treat. 2016 Jul;158(2):219-32. doi: 10.1007/s10549-016-3876-y. Epub 2016 Jul 2. Breast Cancer Res Treat. 2016. PMID: 27372070 Free PMC article. Review. - Application of next generation sequencing to human gene fusion detection: computational tools, features and perspectives.
Wang Q, Xia J, Jia P, Pao W, Zhao Z. Wang Q, et al. Brief Bioinform. 2013 Jul;14(4):506-19. doi: 10.1093/bib/bbs044. Epub 2012 Aug 9. Brief Bioinform. 2013. PMID: 22877769 Free PMC article. Review.
Cited by
- From Samples to Germline and Somatic Sequence Variation: A Focus on Next-Generation Sequencing in Melanoma Research.
Muñoz-Barrera A, Rubio-Rodríguez LA, Díaz-de Usera A, Jáspez D, Lorenzo-Salazar JM, González-Montelongo R, García-Olivares V, Flores C. Muñoz-Barrera A, et al. Life (Basel). 2022 Nov 21;12(11):1939. doi: 10.3390/life12111939. Life (Basel). 2022. PMID: 36431075 Free PMC article. Review. - Novornabreak: Local Assembly for Novel Splice Junction and Fusion Transcript Detection from RNA-Seq Data.
Tan Y, Mohanty V, Liang S, Dou J, Ma J, Kim KH, Bonder MJ, Shi X, Lee C; Human Genome Structural Variation Consortium; Chong Z, Chen K. Tan Y, et al. J Bioinform Syst Biol. 2023;6(2):74-81. doi: 10.26502/jbsb.5107050. Epub 2023 Apr 4. J Bioinform Syst Biol. 2023. PMID: 39301431 Free PMC article. - Pleomorphic adenomas and mucoepidermoid carcinomas of the breast are underpinned by fusion genes.
Pareja F, Da Cruz Paula A, Gularte-Mérida R, Vahdatinia M, Li A, Geyer FC, da Silva EM, Nanjangud G, Wen HY, Varga Z, Brogi E, Rakha EA, Weigelt B, Reis-Filho JS. Pareja F, et al. NPJ Breast Cancer. 2020 Jun 5;6:20. doi: 10.1038/s41523-020-0164-0. eCollection 2020. NPJ Breast Cancer. 2020. PMID: 32550265 Free PMC article. - Detecting intragenic trans-splicing events from non-co-linearly spliced junctions by hybrid sequencing.
Chen YC, Chen CY, Chiang TW, Chan MH, Hsiao M, Ke HM, Tsai IJ, Chuang TJ. Chen YC, et al. Nucleic Acids Res. 2023 Aug 25;51(15):7777-7797. doi: 10.1093/nar/gkad623. Nucleic Acids Res. 2023. PMID: 37497782 Free PMC article. - Comparative study of bioinformatic tools for the identification of chimeric RNAs from RNA Sequencing.
Singh S, Li H. Singh S, et al. RNA Biol. 2021 Oct 15;18(sup1):254-267. doi: 10.1080/15476286.2021.1940047. Epub 2021 Jun 18. RNA Biol. 2021. PMID: 34142643 Free PMC article.
References
- Asmann YW, Necela BM, Kalari KR, Hossain A, Baker TR, Carr JM, Davis C, Getz JE, Hostetter G, Li X, et al. 2012. Detection of redundant fusion transcripts as biomarkers or disease-specific therapeutic targets in breast cancer. Cancer Res 72: 1921–1928. - PubMed
Publication types
MeSH terms
Grants and funding
- U54HG003079/HG/NHGRI NIH HHS/United States
- U54 HG003079/HG/NHGRI NIH HHS/United States
- R00 CA149182/CA/NCI NIH HHS/United States
- R21 CA185983/CA/NCI NIH HHS/United States
- R21 CA185983-01/CA/NCI NIH HHS/United States
LinkOut - more resources
Full Text Sources
Other Literature Sources


