EpCAM based capture detects and recovers circulating tumor cells from all subtypes of breast cancer except claudin-low - PubMed (original) (raw)
Comparative Study
. 2015 Dec 29;6(42):44623-34.
doi: 10.18632/oncotarget.5977.
Neal Mineyev 3, Weizhu Zhu 1 2, Emily Park 4, Chip Lomas 5, Vasu Punj 2 6, Min Yu 2 7, Dany Barrak 1 2, Victoria Forte 2, Tania Porras 1 2, Debu Tripathy 8, Julie E Lang 1 2
Affiliations
- PMID: 26556851
- PMCID: PMC4792580
- DOI: 10.18632/oncotarget.5977
Comparative Study
EpCAM based capture detects and recovers circulating tumor cells from all subtypes of breast cancer except claudin-low
Alexander Ring et al. Oncotarget. 2015.
Abstract
Purpose: The potential utility of circulating tumor cells (CTCs) as liquid biopsies is of great interest. We hypothesized that CTC capture using EpCAM based gating is feasible for most breast cancer subtypes.
Results: Cancer cells could be recovered from all intrinsic subtypes of breast cancer with IE/FACS, however, claudin-low cell lines showed very low capture rates compared to the four other groups (p = 0.03). IE/FACS detection of CTC mimic cells was time sensitive, emphasizing controlling for pre-analytic variables in CTC studies. Median fluorescent intensity for flow cytometry and RNA flow cell type characterization were highly correlated, predicting for CTC isolation across molecular subtypes. RNA-Seq of IE/FACS sorted single cell equivalents showed high correlation compared to bulk cell lines, and distinct gene expression signatures compared to PB.
Materials and methods: Ten cell lines representing all major subtypes of breast cancer were spiked (as CTC mimics) into and recovered from peripheral blood (PB) using immunomagnetic enrichment followed by fluorescence-activated cell sorting (IE/FACS). Flow cytometry and RNA flow were used to quantify the expression of multiple breast cancer related markers of interest. Two different RNA-Seq technologies were used to analyze global gene expression of recovered sorted cells compared to bulk cell lines and PB.
Conclusions: EpCAM based IE/FACS detected and captured a portion of spiked cells from each of the 10 cell lines representing all breast cancer subtypes, including basal-like but not claudin-low cancers. The assay allows for the isolation of high quality RNA suitable for accurate RNA-Seq of heterogeneous rare cell populations.
Keywords: EpCAM; IE/FACS; breast cancer; circulating tumor cells.
Conflict of interest statement
CONFLICTS OF INTEREST
BD Biosciences performed the RNA flow experiments described above and made these results available to the corresponding author, who independently reviewed these data and made the decision to publish this work. Emily Park and Chip Lomas are employees of BD Biosciences. Julie E. Lang is a member of the Genomic Health speaker bureau. No other author has any relevant financial relationships to disclose.
Figures
Figure 1
A. Bar graph representation of recovery rates (n = 3 for each cell line). Overall recovery rates for PBS 51.4%, PB 39.5%. Recovery rates are statistically significantly different based on subtype (p = 0.02). B. Time course experiment demonstrating the rapid decline in cell recovery as a function of blood draw-to-isolation time (n = 3 per time point).
Figure 2. qRT-PCR comparing gene expression of bulk BT474 (BT474b) (blue) and sorted BT474 (BT474s) (green) to PB
Results are represented as fold change (2−ΔΔCt) (n = 3). Epithelial cell specific genes not expressed by blood cells were significantly higher expressed in bulk and sorted BT474 compared to blood: EpCAM (4-fold BT474b, 8.1-fold BT474s), HER2 (2.4-fold BT474b, 5.3-fold BT474s). Expression of genes predominantly found on blood and endothelial cells was significantly lower in bulk and sorted BT474 compared to PB: CD45 (not detected in BT474b (*), 0.00003-fold BT474s), CD31 (0.0007-fold BT474b, 0.001 BT474s). Gene expression differences between sorted and bulk BT474 was not statistically significant (2-way ANOVA, p = 0.2).
Figure 3. Characterization of breast cancer subtypes
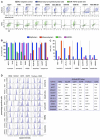
A–C. RNA flow. A. Density plots representing mesenchymal (FITC, x-axis) and epithelial (PE-YG, y-axis) marker RNA expression (top row), as well as ER (APC, x-axis) and HER2 (BV421, y-axis) RNA expression in 10 breast cancer cell lines. B. The number of positive cells (panel A) correlated with subtype classification for all probe sets, except for epithelial markers. C. MFI revealed bright subpopulations within each cell line, independent of subtype. Cells expressing high levels of mesenchymal markers were present in luminal subtypes (T47D, BT474), while the basal like cell line SUM149 showed high expression of epithelial markers. D. FACS. Epithelial cell (EpCAM, CDH1) and breast cancer marker-expression (HER2, EGFR) correlated with the clinical subtype classification. Staining with the benzothiazole thioflavin (TF) successfully captured nucleated cells. Expression of the white blood cell marker CD45 was equally low in all cell lines.
Figure 4. Helicos sequencing data
A–C. Scatter plots demonstrating high correlation between low (10 pg) and high (500 pg) RNA inputs (R = 0.94, A.) low RNA input and sorted cells (R = 0.87, B.) but no correlation between sorted cells and PB (R = 0.32, C.) (Pearson's correlation analysis). D. PCA analysis demonstrated similarity between sorted BT474 and different RNA inputs from bulk BT474, and separation from PB. E. HC of 274 genes, which show differential expression of FC ≥ ± 2 (FDR adjusted p < 0.05) and differentiate BT474 (sorted cells and bulk cell RNA) from PB blood.
Figure 5. Helicos sequencing gene expression detection sensitivity
A detailed analysis of detected genes based on transcript abundance shows high correlation between low and high RNA inputs.
Figure 6. Illumina high seq. data
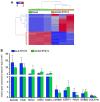
A. Unsupervised hierarchical clustering of RNA-Seq data from PB and sorted BT474. A signature of 123 differentially expressed genes (FC ≥ ± 2, FDR adjusted p < 0.05) clearly separate sorted cancer cells from PB (n = 3 each). B. qRT-PCR validation. Ten genes selected from the RNA-Seq results show similar expression trends in BT474 sorted and bulk compared to PB. Expression levels are not statistically significantly different between sorted and bulk cells (2-way ANOVA, p = 0.7).
Similar articles
- Expression profiling of circulating tumor cells in metastatic breast cancer.
Lang JE, Scott JH, Wolf DM, Novak P, Punj V, Magbanua MJ, Zhu W, Mineyev N, Haqq CM, Crothers JR, Esserman LJ, Tripathy D, van 't Veer L, Park JW. Lang JE, et al. Breast Cancer Res Treat. 2015 Jan;149(1):121-31. doi: 10.1007/s10549-014-3215-0. Epub 2014 Nov 29. Breast Cancer Res Treat. 2015. PMID: 25432738 Free PMC article. Clinical Trial. - Detection of EpCAM positive and negative circulating tumor cells in metastatic breast cancer patients.
Königsberg R, Obermayr E, Bises G, Pfeiler G, Gneist M, Wrba F, de Santis M, Zeillinger R, Hudec M, Dittrich C. Königsberg R, et al. Acta Oncol. 2011 Jun;50(5):700-10. doi: 10.3109/0284186X.2010.549151. Epub 2011 Jan 24. Acta Oncol. 2011. PMID: 21261508 - RNA-Seq of Circulating Tumor Cells in Stage II-III Breast Cancer.
Lang JE, Ring A, Porras T, Kaur P, Forte VA, Mineyev N, Tripathy D, Press MF, Campo D. Lang JE, et al. Ann Surg Oncol. 2018 Aug;25(8):2261-2270. doi: 10.1245/s10434-018-6540-4. Epub 2018 Jun 4. Ann Surg Oncol. 2018. PMID: 29868978 Free PMC article. - Circulating tumour cells: the evolving concept and the inadequacy of their enrichment by EpCAM-based methodology for basic and clinical cancer research.
Grover PK, Cummins AG, Price TJ, Roberts-Thomson IC, Hardingham JE. Grover PK, et al. Ann Oncol. 2014 Aug;25(8):1506-16. doi: 10.1093/annonc/mdu018. Epub 2014 Mar 20. Ann Oncol. 2014. PMID: 24651410 Review. - The challenge of gene expression profiling in heterogeneous clinical samples.
Rodrıguez-Gonzalez FG, Mustafa DA, Mostert B, Sieuwerts AM. Rodrıguez-Gonzalez FG, et al. Methods. 2013 Jan;59(1):47-58. doi: 10.1016/j.ymeth.2012.05.005. Epub 2012 May 29. Methods. 2013. PMID: 22652627 Review.
Cited by
- Microfluidics cell sample preparation for analysis: Advances in efficient cell enrichment and precise single cell capture.
Huang L, Bian S, Cheng Y, Shi G, Liu P, Ye X, Wang W. Huang L, et al. Biomicrofluidics. 2017 Feb 6;11(1):011501. doi: 10.1063/1.4975666. eCollection 2017 Jan. Biomicrofluidics. 2017. PMID: 28217240 Free PMC article. Review. - Heterogeneity and molecular landscape of melanoma: implications for targeted therapy.
Beigi YZ, Lanjanian H, Fayazi R, Salimi M, Hoseyni BHM, Noroozizadeh MH, Masoudi-Nejad A. Beigi YZ, et al. Mol Biomed. 2024 May 10;5(1):17. doi: 10.1186/s43556-024-00182-2. Mol Biomed. 2024. PMID: 38724687 Free PMC article. Review. - Synchronous Detection of Circulating Tumor Cells in Blood and Disseminated Tumor Cells in Bone Marrow Predicts Adverse Outcome in Early Breast Cancer.
Magbanua MJM, Yau C, Wolf DM, Lee JS, Chattopadhyay A, Scott JH, Bowlby-Yoder E, Hwang ES, Alvarado M, Ewing CA, Delson AL, Van't Veer LJ, Esserman L, Park JW. Magbanua MJM, et al. Clin Cancer Res. 2019 Sep 1;25(17):5388-5397. doi: 10.1158/1078-0432.CCR-18-3888. Epub 2019 May 29. Clin Cancer Res. 2019. PMID: 31142502 Free PMC article. - Circulating tumor cells in breast cancer.
Bidard FC, Proudhon C, Pierga JY. Bidard FC, et al. Mol Oncol. 2016 Mar;10(3):418-30. doi: 10.1016/j.molonc.2016.01.001. Epub 2016 Jan 12. Mol Oncol. 2016. PMID: 26809472 Free PMC article. Review. - Advances in single-cell RNA sequencing and its applications in cancer research.
Zhu S, Qing T, Zheng Y, Jin L, Shi L. Zhu S, et al. Oncotarget. 2017 May 16;8(32):53763-53779. doi: 10.18632/oncotarget.17893. eCollection 2017 Aug 8. Oncotarget. 2017. PMID: 28881849 Free PMC article. Review.
References
- Ferlay J, Soerjomataram I, Ervik M, Dikshit R, Eser S, Mathers C, Rebelo M, Parkin DM, Forman D, Bray F. GLOBOCAN 2012 v1.0, Cancer Incidence and Mortality Worldwide: IARC CancerBase No. 11 [Internet] Lyon, France: International Agency for Research on Cancer; 2013.
- Hayes DF, Smerage J. Is there a role for circulating tumor cells in the management of breast cancer? Clin Cancer Res. 2008;14:3646–3650. - PubMed
- Kasimir-Bauer S. Circulating tumor cells as markers for cancer risk assessment and treatment monitoring. Mol Diagn Ther. 2009;13:209–215. - PubMed
- Pantel K, Alix-Panabieres C, Riethdorf S. Cancer micrometastases. Nat Rev Clin Oncol. 2009;6:339–351. - PubMed
Publication types
MeSH terms
Substances
LinkOut - more resources
Full Text Sources
Other Literature Sources
Medical
Miscellaneous


