Autophagy limits proliferation and glycolytic metabolism in acute myeloid leukemia - PubMed (original) (raw)
doi: 10.1038/cddiscovery.2015.8.
Thomas Riffelmacher 2, Amanda Stranks 2, Owen Williams 3, Jasper De Boer 3, Kelvin Cain 4, Marion MacFarlane 4, Joanna McGouran 5, Benedikt Kessler 5, Shivani Khandwala 2, Onima Chowdhury 6, Daniel Puleston 2, Kanchan Phadwal 7, Monika Mortensen 2, David Ferguson 8, Elizabeth Soilleux 8, Petter Woll 6, Sten Eirik W Jacobsen 6, Anna Katharina Simon 1
Affiliations
- PMID: 26568842
- PMCID: PMC4641322
- DOI: 10.1038/cddiscovery.2015.8
Autophagy limits proliferation and glycolytic metabolism in acute myeloid leukemia
Alexander S Watson et al. Cell Death Discov. 2015.
Abstract
Decreased autophagy contributes to malignancies, however it is unclear how autophagy impacts on tumour growth. Acute myeloid leukemia (AML) is an ideal model to address this as (i) patient samples are easily accessible, (ii) the hematopoietic stem and progenitor population (HSPC) where transformation occurs is well characterized, and (iii) loss of the key autophagy gene Atg7 in hematopoietic stem and progenitor cells (HSPCs) leads to a lethal pre-leukemic phenotype in mice. Here we demonstrate that loss of Atg5 results in an identical HSPC phenotype as loss of Atg7, confirming a general role for autophagy in HSPC regulation. Compared to more committed/mature hematopoietic cells, healthy human and mouse HSCs displayed enhanced basal autophagic flux, limiting mitochondrial damage and reactive oxygen species in this long-lived population. Taken together, with our previous findings these data are compatible with autophagy limiting leukemic transformation. In line with this, autophagy gene losses are found within chromosomal regions that are commonly deleted in human AML. Moreover, human AML blasts showed reduced expression of autophagy genes, and displayed decreased autophagic flux with accumulation of unhealthy mitochondria indicating that deficient autophagy may be beneficial to human AML. Crucially, heterozygous loss of autophagy in an MLL-ENL model of AML led to increased proliferation in vitro, a glycolytic shift, and more aggressive leukemias in vivo. With autophagy gene losses also identified in multiple other malignancies, these findings point to low autophagy providing a general advantage for tumour growth.
Keywords: Acute Myeloid Leukemia (AML); Autophagy; Cancer; Glycolysis; Hematopoiesis; Hematopoietic Stem Cell; Metabolism; Myeloid cells.
Figures
Figure 1
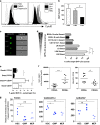
The autophagic flux is high in human and murine HSPCs. (a) Representative histograms of CytoID staining of indicated mouse bone marrow populations and indicated treatment, quantified as GFMI in (b) _n_=2, _t_-test. Rapamycin serves as control inducing autophagy. (c) Representative images and (d) quantification of ex vivo LC3-GFP puncta in LSK or LK HSPCs, CD11b+Gr1− (neutrophil) or B220+ (B cell) BM populations from transgenic GFP-LC3 mice (‘+ I’ indicates 2 h E64D/PepA lysosomal inhibitor treatment), using Image Stream assessment of % cells with four or more bright puncta (_n_=4). (e) Frequency of CD34+ and CD34− human BM mononuclear cells in LysoID/LC3 double-positive population with high LC3/LysoID BDS (Bright Detail Similarity; 20 000 cells analyzed per sample, _n_=6 healthy donors, Wilcoxon test *P<0.05 comparing populations within donors). (f) Geometric mean fluorescent intensity (GMFI) of nonyl-acridine orange (NaO, mitochondrial health) and (c) mitochondrial ROS (MitoSOX) staining in CD34+ and CD34− human BM cells. (g) Gene expression (RNAseq analysis) of human HSC, GMP and MEP, _n_=3 healthy donors. All bar graph values are mean values± S.E.M.; _P_-values are obtained with Mann–Whitney test (*P<0.05, **P<0.01, ***P<0.001), unless otherwise stated.
Figure 2
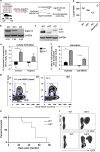
Decreased autophagy in human AML blasts. (a) Expression of autophagy genes in blast marker-positive BMNCs from AML patients relative to blast marker-negative cell expression (value for each donor represents the mean from three independent sorts, measured in triplicate by Fluidigm, normalized to GAPDH). (b) Frequency of blast marker-positive or -negative cells from AML BMNCs with high LC3/LysoID colocalization (BDS) under basal conditions or after E64D/Pepstatin A treatment (Basal+Inh; _n_=13, Wilcoxon test comparing populations within donors *P<0.05, **P<0.01, ***P<0.001). (c) Representative immunohistochemistry of p62 in bone marrow trephine samples from AML patients (_n_=8 donors) or healthy controls (_n_=4 donors) either with antibody pre-incubated with blocking peptide or with antibody alone (scale bar 50 _μ_m). (d) The geometric mean fluorescence intensity of nonyl-acridine orange (NaO) and ROS (by MitoSOX) of blast marker-positive BM cells from AML patients compared with CD34+ cells from healthy BM donors (Mann–Whitney test).
Figure 3
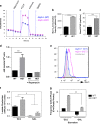
Heterozygous deletion of Atg5 in a MLL–ENL AML model mediates increased proliferation and leukemogenic potential. (a) Generation of conditional Atg5 −/− (KO), Atg5 +/− (HET), Atg5 +/+ (WT), empty vector or MLL–ENL transduced leukemic lines, in which Cre-expressing retrovirus was used to delete Atg5 expression. (b) Western blot for Atg5 (Atg5 is typically only visible in Atg5/12 complex). (c) LC3 or GAPDH protein levels in protein lysates from leukemic lines. (d) Geometric fluorescence mean intensity of CytoID staining of MLL–ENL lines; Rapamycin treatment of WT lines serves as positive control. (e) difference in number of colonies formed in complete methylcellulose by 500 cells from leukemic lines following 72-h culture in normoxia or 0.1% oxygen (_n_=3 per line, representative of two experiments). (f) Quantification of BrdU plots from leukemic lines under starvation, gated as in g, showing difference in frequency of cells in the S phase or dead cells (sub-GO/G1; Cre-transduced subtract genotype empty vector frequency; _n_=5 cultures over three experiments) or (g) representative plots of BrdU incorporation against DNA content (7AAD intensity) delineating cell cycle stages and dead cells (sub-GO/G1) in leukemic lines starved for 18 h (reduced serum (2%) no growth factors). (h) Survival of sublethally irradiated C57BL/6 mice (2×3 Gy) intravenously injected with 1×10⁶ primary leukemic cells with Atg5 wt/wt or Atg fl/wt genotypes transduced with CRE-IRES-GFP retrovirus, sorted on GFP expression pre-injection; 10 mice per genotype were scored regularly and killed on development of clinical symptoms with pre-determined score threshold. All bar graph values are mean±S.E.M.; _P_-values are obtained with two-tailed _t_-test (*P<0.05), unless otherwise stated. See also Supplementary Figure S4 for normoxia (Supplementary Figure S4A) and hypoxia (Supplementary Figure S4B).
Figure 4
Heterozygous loss of Atg5 causes increased glycolytic dependence. (a) OCR with (b) quantification after addition of FCCP and (c) basal ECAR of 280 000 cells from MLL–ENL cell lines assayed on the Seahorse Bioanalyzer with addition of mitochondrial inhibitors: (A) Oligomycin 400 nM; (B) FCCP, 400 nM; (C) Rotenone 1 µM; (D) media only (mean±S.D., five cultures assessed per genotype, representative experiment of two). (d) Enzymatic lactate assessment in supernatant of MLL–ENL lines after 48-h culture. (e) Histogram of Glut1 fluorescence intensity of MLL–ENL cell lines. (f) Enzymatic assessment of MLL–ENL line lactate production during culture with 20 mM glycolysis inhibitor galactose (GAL) or 20 mM glucose (GLU). (g) Frequency of cells in the S phase in Cre-transduced lines after culture with either 20 mM glucose or galactose, first for 24 h in complete media (10% FCS and cytokines) then under starvation conditions for 18 h (2% serum, no cytokines; _n_=2, mean±S.E.M.). _P_-values were obtained with two-tailed _t_-test (*P<0.05, **P<0.01, ***P<0.001, ****P<0.0001), unless otherwise stated.
Similar articles
- Autophagy Proteins ATG5 and ATG7 Are Essential for the Maintenance of Human CD34(+) Hematopoietic Stem-Progenitor Cells.
Gomez-Puerto MC, Folkerts H, Wierenga AT, Schepers K, Schuringa JJ, Coffer PJ, Vellenga E. Gomez-Puerto MC, et al. Stem Cells. 2016 Jun;34(6):1651-63. doi: 10.1002/stem.2347. Epub 2016 Mar 28. Stem Cells. 2016. PMID: 26930546 - Atg5-dependent autophagy contributes to the development of acute myeloid leukemia in an MLL-AF9-driven mouse model.
Liu Q, Chen L, Atkinson JM, Claxton DF, Wang HG. Liu Q, et al. Cell Death Dis. 2016 Sep 8;7(9):e2361. doi: 10.1038/cddis.2016.264. Cell Death Dis. 2016. PMID: 27607576 Free PMC article. - Lack of autophagy in the hematopoietic system leads to loss of hematopoietic stem cell function and dysregulated myeloid proliferation.
Mortensen M, Watson AS, Simon AK. Mortensen M, et al. Autophagy. 2011 Sep;7(9):1069-70. doi: 10.4161/auto.7.9.15886. Epub 2011 Sep 1. Autophagy. 2011. PMID: 21552009 Free PMC article. - Advances in Understanding the Links between Metabolism and Autophagy in Acute Myeloid Leukemia: From Biology to Therapeutic Targeting.
Saulle E, Spinello I, Quaranta MT, Labbaye C. Saulle E, et al. Cells. 2023 Jun 5;12(11):1553. doi: 10.3390/cells12111553. Cells. 2023. PMID: 37296673 Free PMC article. Review. - Autophagy in the pathogenesis of myelodysplastic syndrome and acute myeloid leukemia.
Watson AS, Mortensen M, Simon AK. Watson AS, et al. Cell Cycle. 2011 Jun 1;10(11):1719-25. doi: 10.4161/cc.10.11.15673. Epub 2011 Jun 1. Cell Cycle. 2011. PMID: 21512311 Free PMC article. Review.
Cited by
- MiR-15a-5p Confers Chemoresistance in Acute Myeloid Leukemia by Inhibiting Autophagy Induced by Daunorubicin.
Bollaert E, Claus M, Vandewalle V, Lenglez S, Essaghir A, Demoulin JB, Havelange V. Bollaert E, et al. Int J Mol Sci. 2021 May 13;22(10):5153. doi: 10.3390/ijms22105153. Int J Mol Sci. 2021. PMID: 34068078 Free PMC article. - Lysosomes in Stem Cell Quiescence: A Potential Therapeutic Target in Acute Myeloid Leukemia.
Jain V, Bose S, Arya AK, Arif T. Jain V, et al. Cancers (Basel). 2022 Mar 23;14(7):1618. doi: 10.3390/cancers14071618. Cancers (Basel). 2022. PMID: 35406389 Free PMC article. Retracted. Review. - The dual role of autophagy in acute myeloid leukemia.
Seo W, Silwal P, Song IC, Jo EK. Seo W, et al. J Hematol Oncol. 2022 May 7;15(1):51. doi: 10.1186/s13045-022-01262-y. J Hematol Oncol. 2022. PMID: 35526025 Free PMC article. Review. - Targeting Autophagy in Cancer: Recent Advances and Future Directions.
Amaravadi RK, Kimmelman AC, Debnath J. Amaravadi RK, et al. Cancer Discov. 2019 Sep;9(9):1167-1181. doi: 10.1158/2159-8290.CD-19-0292. Epub 2019 Aug 21. Cancer Discov. 2019. PMID: 31434711 Free PMC article. Review. - LMWPTP modulates the antioxidant response and autophagy process in human chronic myeloid leukemia cells.
Faria AVS, Clerici SP, de Souza Oliveira PF, Queiroz KCS, Peppelenbosch MP, Ferreira-Halder CV. Faria AVS, et al. Mol Cell Biochem. 2020 Mar;466(1-2):83-89. doi: 10.1007/s11010-020-03690-1. Epub 2020 Feb 4. Mol Cell Biochem. 2020. PMID: 32016696
References
- Hosokawa N , Hara Y , Mizushima N . Generation of cell lines with tetracycline-regulated autophagy and a role for autophagy in controlling cell size. FEBS Lett 2006; 580: 2623–2629. - PubMed
Grants and funding
- MC_U132685863/MRC_/Medical Research Council/United Kingdom
- 103830/Wellcome Trust/United Kingdom
- MC_UU_12009/5/MRC_/Medical Research Council/United Kingdom
- Wellcome Trust/United Kingdom
- BB/G021422/1/BB_/Biotechnology and Biological Sciences Research Council/United Kingdom
- G0501838/MRC_/Medical Research Council/United Kingdom
LinkOut - more resources
Full Text Sources
Other Literature Sources


