Anharmonic Effects on Vibrational Spectra Intensities: Infrared, Raman, Vibrational Circular Dichroism, and Raman Optical Activity - PubMed (original) (raw)
Anharmonic Effects on Vibrational Spectra Intensities: Infrared, Raman, Vibrational Circular Dichroism, and Raman Optical Activity
Julien Bloino et al. J Phys Chem A. 2015.
Abstract
The aim of this paper is 2-fold. First, we want to report the extension of our virtual multifrequency spectrometer (VMS) to anharmonic intensities for Raman optical activity (ROA) with the full inclusion of first- and second-order resonances for both frequencies and intensities in the framework of the generalized second-order vibrational perturbation theory (GVPT2) for all kinds of vibrational spectroscopies. Then, from a more general point of view, we want to present and validate the performance of VMS for the parallel analysis of different vibrational spectra for medium-sized molecules (IR, Raman, VCD, ROA) including both mechanical and electric/magnetic anharmonicity. For the well-known methyloxirane benchmark, careful selection of density functional, basis set, and resonance thresholds permitted us to reach qualitative and quantitative agreement between experimental and computed band positions and shapes. Next, the whole series of halogenated azetidinones is analyzed, showing that it is now possible to interpret different spectra in terms of mass, electronegativity, polarizability, and hindrance variation between closely related substituents, chiral spectroscopies being particular effective in this connection.
Figures
Figure 1
Molecular structures of methyloxirane (a) and 4-X-2-azetidinones (X=F, Cl, Br) (b) along with the atom labelling in line with references and, respectively.
Figure 2
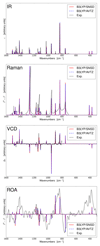
Fully anharmonic IR, Raman, VCD and ROA spectra of (R)-methyloxirane compared to their experimental counterparts measured in low-temperature Ar Matrix (IR, VCD76) or gas phase (Raman, ROA79). Vibrational wavenumbers have been computed at the “cheapCC”/B3LYP level in conjunction with B3LYP intensities. B3LYP computations have been performed with the SNSD and aug-cc-pVTZ (AVTZ) basis sets. All spectra have been convoluted by means of Lorentzian distribution functions with FWHM of 2 cm–1.
Figure 3
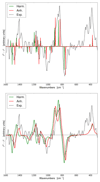
Harmonic and fully anharmonic VCD spectra of (R)-methyloxirane in the 800–940 cm–1 range compared to experiment. Harmonic wavenumbers have been computed at the “cheapCC” level and combined with anharmonic corrections at the B3LYP/SNSD level. VCD harmonic and anharmonic intensities are computed at B3LYP/SNSD level. All spectra have been convoluted by means of Lorentzian distribution functions with FWHM of 2 cm–1.
Figure 4
Harmonic and fully anharmonic ROA spectra of (R)-methyloxirane compared to its experimental counterpart (in the gas phase79). Harmonic wavenumbers have been computed at the “cheapCC” level and combined with anharmonic corrections at the B3LYP/SNSD level. ROA harmonic and anharmonic intensities are computed at B3LYP/SNSD level. Theoretical spectra have been convoluted by means of Lorentzian distribution functions with FWHM of 2 cm–1 (upper panel) and of 40 cm–1 (lower panel).
Figure 5
Theoretical IR, VCD, Raman and ROA spectra of (R)-4-fluoro-2-azetidinone in the 300–1600 cm−1 range. Fully harmonic (harmonic energies and intensities) spectra (red, upper traces), spectra obtained by combining anharmonic wavenumbers with harmonic intensities (blue, middle traces) and fully anharmonic (anharmonic energies and intensities) spectra (green, lower traces). All computations have been performed at the B3LYP/SNSD level, and the computed lines have been convoluted by means of Lorentzian distribution functions with FWHM of 4 cm−1.
Figure 6
Fully anharmonic IR, VCD, Raman and ROA spectra of (R)-4-X-2-azetidinones (X=F, Cl, Br) in the 300–4000 cm−1 range. All computations have been performed at the B3LYP/SNSD level, and the computed lines have been convoluted by means of Lorentzian distribution functions with FWHM of 4 cm−1.
Figure 7
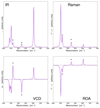
Fully anharmonic IR, VCD, Raman and ROA spectra of (R)-4-Br-azetidinone in the 300–600 cm−1 range, highlighted in light blue in Figure 6. _υ_19 and _υ_20 vibrations are marked by asterisks. All computations have been performed at the B3LYP/SNSD level, and the computed lines have been convoluted by means of Lorentzian distribution functions with FWHM of 4 cm−1.
Similar articles
- Anharmonic Aspects in Vibrational Circular Dichroism Spectra from 900 to 9000 cm-1 for Methyloxirane and Methylthiirane.
Fusè M, Longhi G, Mazzeo G, Stranges S, Leonelli F, Aquila G, Bodo E, Brunetti B, Bicchi C, Cagliero C, Bloino J, Abbate S. Fusè M, et al. J Phys Chem A. 2022 Sep 29;126(38):6719-6733. doi: 10.1021/acs.jpca.2c05332. Epub 2022 Sep 20. J Phys Chem A. 2022. PMID: 36126273 Free PMC article. - Analytic calculations of anharmonic infrared and Raman vibrational spectra.
Cornaton Y, Ringholm M, Louant O, Ruud K. Cornaton Y, et al. Phys Chem Chem Phys. 2016 Feb 7;18(5):4201-15. doi: 10.1039/c5cp06657c. Phys Chem Chem Phys. 2016. PMID: 26784673 Free PMC article. - Anharmonic effects in IR, Raman, and Raman optical activity spectra of alanine and proline zwitterions.
Danecek P, Kapitán J, Baumruk V, Bednárová L, Kopecký V Jr, Bour P. Danecek P, et al. J Chem Phys. 2007 Jun 14;126(22):224513. doi: 10.1063/1.2738065. J Chem Phys. 2007. PMID: 17581069 - The Clusters-in-a-Liquid Approach for Solvation: New Insights from the Conformer Specific Gas Phase Spectroscopy and Vibrational Optical Activity Spectroscopy.
Perera AS, Thomas J, Poopari MR, Xu Y. Perera AS, et al. Front Chem. 2016 Feb 25;4:9. doi: 10.3389/fchem.2016.00009. eCollection 2016. Front Chem. 2016. PMID: 26942177 Free PMC article. Review. - Determination of absolute configuration of chiral molecules using vibrational optical activity: a review.
He Y, Wang B, Dukor RK, Nafie LA. He Y, et al. Appl Spectrosc. 2011 Jul;65(7):699-723. doi: 10.1366/11-06321. Appl Spectrosc. 2011. PMID: 21740631 Review.
Cited by
- An Effective and Automated Processing of Resonances in Vibrational Perturbation Theory Applied to Spectroscopy.
Yang Q, Bloino J. Yang Q, et al. J Phys Chem A. 2022 Dec 15;126(49):9276-9302. doi: 10.1021/acs.jpca.2c06460. Epub 2022 Nov 30. J Phys Chem A. 2022. PMID: 36450042 Free PMC article. - Quantifying Conformational Isomerism in Chain Molecules by Linear Raman Spectroscopy: The Case of Methyl Esters.
Gawrilow M, Suhm MA. Gawrilow M, et al. Molecules. 2021 Jul 27;26(15):4523. doi: 10.3390/molecules26154523. Molecules. 2021. PMID: 34361676 Free PMC article. - A Holistic Approach to Determining Stereochemistry of Potential Pharmaceuticals by Circular Dichroism with β-Lactams as Test Cases.
Górecki M, Frelek J. Górecki M, et al. Int J Mol Sci. 2021 Dec 27;23(1):273. doi: 10.3390/ijms23010273. Int J Mol Sci. 2021. PMID: 35008698 Free PMC article. - Graphene Domain Signature of Raman Spectra of _sp_2 Amorphous Carbons.
Sheka EF, Golubev YA, Popova NA. Sheka EF, et al. Nanomaterials (Basel). 2020 Oct 14;10(10):2021. doi: 10.3390/nano10102021. Nanomaterials (Basel). 2020. PMID: 33066381 Free PMC article. - Insights into the Thermally Activated Cyclization Mechanism in a Linear Phenylalanine-Alanine Dipeptide.
Carlini L, Chiarinelli J, Mattioli G, Castrovilli MC, Valentini V, De Stefanis A, Bauer EM, Bolognesi P, Avaldi L. Carlini L, et al. J Phys Chem B. 2022 Apr 28;126(16):2968-2978. doi: 10.1021/acs.jpcb.1c10736. Epub 2022 Apr 19. J Phys Chem B. 2022. PMID: 35438499 Free PMC article.
References
- Laane J, editor. Frontiers of Molecular Spectroscopy. Elsevier; Amsterdam: 2009.
- Quack M, Merkt F, editors. Handbook of High-resolution Spectroscopy. John Wiley & Sons, Inc; 2011. p. 2182.
- Siebert F, Hildebrandt P, editors. Vibrational Spectroscopy in Life Science. Wiley-VCH Verlag GmbH and Co. KGaA; Weinheim, Germany: 2008.
- Astrid G, Rudolf R, Jerker W, editors. Single Molecule Spectroscopy in Chemistry, Physics and Biology: Nobel Symposium. Springer-Verlag; Berlin Heilderberg: 2010.
- Berova N, Polavarapu PL, Nakanishi K, Woody RW, editors. Comprehensive Chiroptical Spectroscopy: Instrumentation, Methodologies, and Theoretical Simulations. John Wiley & Sons, Inc.; Hoboken: New Jersey: 2012.
LinkOut - more resources
Full Text Sources
Other Literature Sources


