Predicting therapeutic nanomedicine efficacy using a companion magnetic resonance imaging nanoparticle - PubMed (original) (raw)
. 2015 Nov 18;7(314):314ra183.
doi: 10.1126/scitranslmed.aac6522.
Suresh Gadde 2, Christina Pfirschke 3, Camilla Engblom 3, Melissa M Sprachman 3, Rainer H Kohler 1, Katherine S Yang 3, Ashley M Laughney 3, Gregory Wojtkiewicz 3, Nazila Kamaly 2, Sushma Bhonagiri 2, Mikael J Pittet 1, Omid C Farokhzad 4, Ralph Weissleder 5
Affiliations
- PMID: 26582898
- PMCID: PMC5462466
- DOI: 10.1126/scitranslmed.aac6522
Predicting therapeutic nanomedicine efficacy using a companion magnetic resonance imaging nanoparticle
Miles A Miller et al. Sci Transl Med. 2015.
Abstract
Therapeutic nanoparticles (TNPs) have shown heterogeneous responses in human clinical trials, raising questions of whether imaging should be used to identify patients with a higher likelihood of NP accumulation and thus therapeutic response. Despite extensive debate about the enhanced permeability and retention (EPR) effect in tumors, it is increasingly clear that EPR is extremely variable; yet, little experimental data exist to predict the clinical utility of EPR and its influence on TNP efficacy. We hypothesized that a 30-nm magnetic NP (MNP) in clinical use could predict colocalization of TNPs by magnetic resonance imaging (MRI). To this end, we performed single-cell resolution imaging of fluorescently labeled MNPs and TNPs and studied their intratumoral distribution in mice. MNPs circulated in the tumor microvasculature and demonstrated sustained uptake into cells of the tumor microenvironment within minutes. MNPs could predictably demonstrate areas of colocalization for a model TNP, poly(d,l-lactic-co-glycolic acid)-b-polyethylene glycol (PLGA-PEG), within the tumor microenvironment with >85% accuracy and circulating within the microvasculature with >95% accuracy, despite their markedly different sizes and compositions. Computational analysis of NP transport enabled predictive modeling of TNP distribution based on imaging data and identified key parameters governing intratumoral NP accumulation and macrophage uptake. Finally, MRI accurately predicted initial treatment response and drug accumulation in a preclinical efficacy study using a paclitaxel-encapsulated NP in tumor-bearing mice. These approaches yield valuable insight into the in vivo kinetics of NP distribution and suggest that clinically relevant imaging modalities and agents can be used to select patients with high EPR for treatment with TNPs.
Copyright © 2015, American Association for the Advancement of Science.
Conflict of interest statement
Competing interests: In compliance with institutional guidelines, O.C.F. discloses his financial interest in BIND Therapeutics, Selecta Biosciences and Blend Therapeutics, which develop nanoparticle medical technologies but did not support this study. Other authors declare no conflicts of interest.
Figures
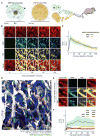
Figure 1. High-resolution intravital imaging of ferumoxytol and polymeric NPs show similar intratumoral behavior
(A) Fluorescently labeled ferumoxytol (MNP) and PLGA-PEG (TNP) were co-injected i.v. into mice for real-time imaging. (B) Time-course measurement of intratumoral MNP and TNP distribution within a live xenograft mouse model of fibrosarcoma transgenically expresses membrane-localized RFP/mApple (HT1080-membrane-mApple). Scale bar = 50 μm. (C) Pharmacokinetics and tumor tissue uptake were quantified for MNPs and TNPs, normalized to concentration (Ct) as a fraction of initial vascular concentration (C0). Data are means (thick lines) ± SD (shading; n≥7 tumor areas across n=3 animals). (D) In the same tumor model as (B–C), contrast-enhanced images show perivascular host cells (green) 10 min after NP injection, distinguishable by cellular morphology, perivascular location, lack of tumor-specific mApple, and MNP accumulation but lack of TNP uptake at early time-points (scale bar = 50 μm). (E) Zoomed-in MNP/TNP distribution within a perivascular host cell (arrows). Note the accumulation kinetics within minutes. Scale bar = 14 μm. (F) Perivascular host cells uptake MNP more rapidly than TNP. Data are means (thick lines) ± SD (shading; n=3 tumors; n>50 cells).
Figure 2. Multi-scale spatial co-localization between MNP and TNP
(A–B) NP tumor uptake in a live xenograft model, 24 h post-injection with MNP. For low (4x) and high (40x) magnification, scale bar denotes 500 μm and 50 μm, respectively. i.v. co-injection with either (A) TNP or (B) a free, un-encapsulated fluorescent derivative of docetaxel were imaged following vascular clearance. (C) MNP and TNP co-localization improves at lower spatial resolution, but MNP and docetaxel co-localization do not. Microscopy images (A–B) were computationally down-sampled to reduce spatial resolution, and pixel-by-pixel Pearson’s correlation (ρ) between MNP/TNP or MNP/docetaxel intensities were calculated across a range of pixel resolutions. Data are means (thick lines) ± SE (n=3 animals and >400 images).
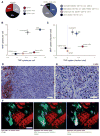
Figure 3. MNP and TNP co-localize to tumor-associated macrophages in a syngeneic cancer model
(A–B) Flow cytometry analysis of intratumoral cellular composition (A) and single-cell NP distribution (B) in KP subcutaneous xenografts co-treated with TNP and MNP for 24 h. Cellular NP uptake was quantified by fluorescence intensity after subtracting autofluorescence of each population and normalized to the highest average NP uptake (macrophage). (C) Cumulative NP uptake across total cell populations within the bulk tumor mass, normalized such that NP uptake across all cell populations, weighted by their relative frequency, sums to 1. Data are means ± SEM (n=12). (D–E) KP xenografts were excised 24 h after MNP and TNP co-treatment, stained with hematoxylin and F4/80 (brown), and imaged at 10x (D; scale-bar = 100 μm) and 40x (E; scale-bar = 50 μm). (F) Adjacent tumor sections were immunostained for EpCAM to label tumor cells and for F4/80 to label macrophages. Note the high uptake of both NPs in F4/80+ phagocytes.
Figure 4. Quantitative finite element analysis describes single-cell reaction-diffusion processes of the EPR effect
(A) Overview of computational modeling and optimization. i) In HT1080 xenografts, automated morphological criteria identify vessels (green/red masking), and early MNP accumulation (white) identifies macrophage (as in Fig. 1D), which are computationally segmented with manual optimization. ii) The finite-element mesh is generated based on image segmentation. iii) Change in concentration over time of free NP (dC/dt) and bound NP (dB/dt), along with boundary conditions describing NP flux across vessel walls (D(dC/dr)) and vessel NP concentrations over time (_C_P) are integrated across the finite-element mesh. iv) Parameters are iteratively optimized by fitting model results to time-lapse imaging data. (B) Model-fitting validation (green and yellow bars) and spatial correlation between MNPs and TNPs, with and without non-linear PK correction based on finite element modeling (grey and black bars). Correlation data are means ± SEM (n > 200 regions; P value determined by permutation test). (C) Parametric sensitivity analysis showing modeling parameters that most sensitively influence total NP accumulation within the bulk tumor at 2 h post-injection. ε: extracellular volume fraction; t1/2 plasma: NP plasma half-life; _B_max: max NP cellular uptake; _k_bind: NP uptake rate; P: vessel permeability. Data are medians ± IQR (n =5; *p=0.01, pooled two-tailed t-test). (D) Example images and corresponding modeling show heterogenous MNP accumulation in tumor regions with few (n=18; left) and many (n=98; right) phagocytes. All scale bars, 50 μm. (E) Finite element modeling accurately predicts increased MNP accumulation in the “high TAM” tumor region (D), measured as average MNP concentration within tumor tissue outside of vessels.
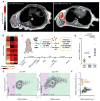
Figure 5. MRI quantifies heterogeneous MNP accumulation and predicts initial TNP response
(A) Example cross-sectional T2 images of HT1080 tumors accumulating low and high intratumoral MNP, with pseudo-color overlays indicating ΔT2 within the tumor region. (B) Heat-map shows T2 mapping averaged over the entire area of each tumor, which stratified a subset of tumors as “low MNP,” “med MNP,” or “high MNP.” (C) Experimental design for using MNP-MRI to predict paclitaxel-loaded TNP response in HT1080 xenografts. (D) FACS analysis shows drug response in tumors exhibiting either low, medium, or high MNP uptake, as determined by MNP-MRI. Tumors with high MNP showed greater populations with abnormally low DNA content (sub-G1 cells) and elevated heterogeneous levels of DNA damage response, determined by deviation (σ) in γH2A.X staining across the population. Data are medians ± IQR (two-tailed t-test). (E) Representative FACS data showing DNA content (using a DNA-intercalating dye) and DNA damage response (using γH2A.X immunostaining) in “low MNP” and “high MNP” tumors. (F) Representative FACS data showing DNA content (using a DNA-intercalating dye) and apoptosis (determined by terminal deoxynucleotidyl transferase dUTP nick end labeling, TUNEL) in tumor cells from a “high MNP” tumor. Contour lines and colors (E–F) denote single-cell distribution density.
Figure 6. MNP predicts longitudinal TNP response and accumulation of TNP payload
(A) Tumor progression in HT1080 tumors ranked according to low, medium, and high MNP as measured by MNP-MRI. Data are means ± SEM (total n=33). (B) In orthotopic 4T1 breast cancer tumors, TNP-encapsulated docetaxel accumulates 25-fold higher in “high MNP” compared to “low MNP” tumors, as determined by fluorescence of excised tumors 1 day after MNP/TNP injection. (C) Using same tumor model as in (B), MNP prediction of un-encapsulated solvent-docetaxel accumulation is significant but relatively modest, only 2.8-fold higher in “high MNP” compared to “low MNP” tumors, as determined by fluorometry. (D) Using same tumor model as in (B), TNP-encapsulated docetaxel was co-injected with fluorescent tumor-targeting (α-EGFR) antibody, which stratified tumors into either “low-,” “med-,” and “high-Ab” groups. Tumor-Ab only modestly predicted drug accumulation, with “high-Ab” tumors showing 3.3-fold higher TNP payload accumulation (*two-tailed t-tests for all; C–E, data are medians ± IQR).
Comment in
- Nanomedicine gets personal.
Tietjen GT, Saltzman WM. Tietjen GT, et al. Sci Transl Med. 2015 Nov 18;7(314):314fs47. doi: 10.1126/scitranslmed.aad6645. Sci Transl Med. 2015. PMID: 26582895 - Magnetic resonance imaging-guided stratified selection of patients for nano-therapy.
Zheng Z, Liang G. Zheng Z, et al. Ann Transl Med. 2016 Oct;4(Suppl 1):S54. doi: 10.21037/atm.2016.10.07. Ann Transl Med. 2016. PMID: 27868022 Free PMC article. No abstract available.
Similar articles
- Development and evaluation of a novel TPGS-mediated paclitaxel-loaded PLGA-mPEG nanoparticle for the treatment of ovarian cancer.
Lv W, Cheng L, Li B. Lv W, et al. Chem Pharm Bull (Tokyo). 2015;63(2):68-74. doi: 10.1248/cpb.c14-00423. Epub 2014 Nov 29. Chem Pharm Bull (Tokyo). 2015. PMID: 25451039 - A targeting drug delivery system for ovarian carcinoma: transferrin modified lipid coated paclitaxel-loaded nanoparticles.
Li R, Zhang Q, Wang XY, Chen XG, He YX, Yang WY, Yang X. Li R, et al. Drug Res (Stuttg). 2014 Oct;64(10):541-7. doi: 10.1055/s-0033-1363957. Epub 2014 Jan 17. Drug Res (Stuttg). 2014. PMID: 24443309 - In vitro &in vivo targeting behaviors of biotinylated Pluronic F127/poly(lactic acid) nanoparticles through biotin-avidin interaction.
Xiong XY, Guo L, Gong YC, Li ZL, Li YP, Liu ZY, Zhou M. Xiong XY, et al. Eur J Pharm Sci. 2012 Aug 15;46(5):537-44. doi: 10.1016/j.ejps.2012.04.011. Epub 2012 Apr 16. Eur J Pharm Sci. 2012. PMID: 22538053 - Prediction of Anti-cancer Nanotherapy Efficacy by Imaging.
Miller MA, Arlauckas S, Weissleder R. Miller MA, et al. Nanotheranostics. 2017 Jul 6;1(3):296-312. doi: 10.7150/ntno.20564. eCollection 2017. Nanotheranostics. 2017. PMID: 29071194 Free PMC article. Review. - Using imaging modalities to predict nanoparticle distribution and treatment efficacy in solid tumors: The growing role of ultrasound.
Cooley MB, Wegierak D, Exner AA. Cooley MB, et al. Wiley Interdiscip Rev Nanomed Nanobiotechnol. 2024 Mar-Apr;16(2):e1957. doi: 10.1002/wnan.1957. Wiley Interdiscip Rev Nanomed Nanobiotechnol. 2024. PMID: 38558290 Review.
Cited by
- Imaging the pharmacology of nanomaterials by intravital microscopy: Toward understanding their biological behavior.
Miller MA, Weissleder R. Miller MA, et al. Adv Drug Deliv Rev. 2017 Apr;113:61-86. doi: 10.1016/j.addr.2016.05.023. Epub 2016 Jun 4. Adv Drug Deliv Rev. 2017. PMID: 27266447 Free PMC article. Review. - Advancements in nanomedicine delivery systems: unraveling immune regulation strategies for tumor immunotherapy.
Zhang Y, Chen X, Hu B, Zou B, Xu Y. Zhang Y, et al. Nanomedicine (Lond). 2024;19(21-22):1821-1840. doi: 10.1080/17435889.2024.2374230. Epub 2024 Jul 16. Nanomedicine (Lond). 2024. PMID: 39011582 Review. - Tumor targeting via EPR: Strategies to enhance patient responses.
Golombek SK, May JN, Theek B, Appold L, Drude N, Kiessling F, Lammers T. Golombek SK, et al. Adv Drug Deliv Rev. 2018 May;130:17-38. doi: 10.1016/j.addr.2018.07.007. Epub 2018 Jul 19. Adv Drug Deliv Rev. 2018. PMID: 30009886 Free PMC article. Review. - Improving accessibility of EPR-insensitive tumor phenotypes using EPR-adaptive strategies: Designing a new perspective in nanomedicine delivery.
Dhaliwal A, Zheng G. Dhaliwal A, et al. Theranostics. 2019 Oct 17;9(26):8091-8108. doi: 10.7150/thno.37204. eCollection 2019. Theranostics. 2019. PMID: 31754383 Free PMC article. Review. - Emerging Nanotheranostics for 5-Fluorouracil in Cancer Therapy: A Systematic Review on Efficacy, Safety, and Diagnostic Capability.
How CW, Teoh SL, Loh JS, Tan SLK, Foo JB, Ng HS, Wong SYW, Ong YS. How CW, et al. Front Pharmacol. 2022 May 18;13:882704. doi: 10.3389/fphar.2022.882704. eCollection 2022. Front Pharmacol. 2022. PMID: 35662688 Free PMC article.
References
- Chow EK, Ho D. Cancer nanomedicine: from drug delivery to imaging. Sci Transl Med. 2013;5:216rv4. - PubMed
- Maeda H, Nakamura H, Fang J. The EPR effect for macromolecular drug delivery to solid tumors: Improvement of tumor uptake, lowering of systemic toxicity, and distinct tumor imaging in vivo. Adv Drug Deliv Rev. 2013;65:71. - PubMed
Publication types
MeSH terms
Substances
Grants and funding
- R01 CA164448/CA/NCI NIH HHS/United States
- U54 CA151884/CA/NCI NIH HHS/United States
- T32 CA079443/CA/NCI NIH HHS/United States
- T32 CA 79443./CA/NCI NIH HHS/United States
- P50 CA086355/CA/NCI NIH HHS/United States
- U54-CA151884/CA/NCI NIH HHS/United States
- 5P50CA086355/CA/NCI NIH HHS/United States
- R01 CA204019/CA/NCI NIH HHS/United States
- R01CA164448/CA/NCI NIH HHS/United States
- R01 HL084312/HL/NHLBI NIH HHS/United States
- HL084312/HL/NHLBI NIH HHS/United States
LinkOut - more resources
Full Text Sources
Other Literature Sources
Medical
Miscellaneous


