Running rewires the neuronal network of adult-born dentate granule cells - PubMed (original) (raw)
Running rewires the neuronal network of adult-born dentate granule cells
Carmen Vivar et al. Neuroimage. 2016.
Abstract
Exercise improves cognition in humans and animals. Running increases neurogenesis in the dentate gyrus of the hippocampus, a brain area important for learning and memory. It is unclear how running modifies the circuitry of new dentate gyrus neurons to support their role in memory function. Here we combine retroviral labeling with rabies virus mediated trans-synaptic retrograde tracing to define and quantify new neuron afferent inputs in young adult male C57Bl/6 mice, housed with or without a running wheel for one month. Exercise resulted in a shift in new neuron networks that may promote sparse encoding and pattern separation. Neurogenesis increased in the dorsal, but not the ventral, dentate gyrus by three-fold, whereas afferent traced cell labeling doubled in number. Regional analysis indicated that running differentially affected specific inputs. Within the hippocampus the ratio of innervation from inhibitory interneurons and glutamatergic mossy cells to new neurons was reduced. Distal traced cells were located in sub-cortical and cortical regions, including perirhinal, entorhinal and sensory cortices. Innervation from entorhinal cortex (EC) was augmented, in proportion to the running-induced enhancement of adult neurogenesis. Within EC afferent input and short-term synaptic plasticity from lateral entorhinal cortex, considered to convey contextual information to the hippocampus was increased. Furthermore, running upregulated innervation from regions important for spatial memory and theta rhythm generation, including caudo-medial entorhinal cortex and subcortical medial septum, supra- and medial mammillary nuclei. Altogether, running may facilitate contextual, spatial and temporal information encoding by increasing adult hippocampal neurogenesis and by reorganization of new neuron circuitry.
Keywords: Adult neurogenesis; Entorhinal cortex; Exercise; Hippocampus; Neural circuitry; Rabies virus; Retrograde tracing; Retrovirus.
Published by Elsevier Inc.
Figures
Fig. 1
Running increases the number of newborn granule cells (GCs) in the adult mouse dentate gyrus (DG) and modifies their inputs. (A) Timeline of the experiment. (B) To label dividing cells control (CON) and running (RUN) mice were injected with retrovirus expressing nuclear GFP, avian TVA receptor and rabies glycoprotein (RV-SYN-GTRgp) into the dorsal and ventral DG. After a one month interval, to allow progenitors to differentiate into new neurons, EnvA-pseudotyped rabies virus expressing MCh (EnvA-ΔG-MCh) was injected into the same sites to trace afferent inputs to newborn GCs. (C) Modified mouse brain atlas (Paxinos and Franklin, 2007) images. Upper panels show the dorso-ventral horizontal section depth (distance from Bregma). Lower panels show overviews of horizontal sections, with the boxed areas corresponding to the DG area shown in the insets in the photomicrographs below. (D, E) Horizontal sections derived from (D) CON and (E) RUN mice. Photomicrographs showing GFP+–MCh+ double labeled cells (green and red = yellow nuclei and red cytoplasm), called starter cells (SC), and MCh+ (red) traced cells (TC) throughout the dorso-ventral extent of the DG. Insets show low power DG overviews, corresponding to the boxed areas (C) in the atlas. (F) Running significantly increases SC number (t(11) = 6.15, P < 0.0001; CON n = 6, RUN n = 7). (G) Dorsal to ventral distribution of SC throughout the extent of the DG. Running significantly increases the number of SC in the dorsal DG (CON, 392 ± 79 vs RUN, 1310 ± 123; t(11) = 6.47, P < 0.0001), but not the middle or ventral DG (middle; CON, 106 ± 32 vs RUN, 148 ± 46, t(11) = 0.46, P = 0.66; ventral: CON, 68 ± 19 vs RUN, 100 ± 21, t(11) = 0.9, P = 0.39). (H) TC number is significantly increased in RUN mice (t(11) = 2.89; P < 0.02; CON n = 6, RUN n = 7). (I) The TC to SC ratio shows a trend towards a decrease in RUN mice as compared to CON mice (t(11) = 2.08; #P = 0.06). Data are means ± S.E.M. *P < 0.05. ML, molecular layer of the DG; GCL, granule cell layer; H, hilus. Nuclei stained with 4′,6-diamidino-2-phenylindole (DAPI), blue.
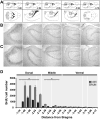
Fig. 2
Dorso-ventral distribution of bromodeoxyuridine (BrdU) labeled cells in the DG of controls and runners. (A) Modified atlas images (Paxinos and Franklin, 2007). Upper images show the dorso-ventral horizontal section depth (distance from Bregma). Lower images show an overview of the horizontal sections, with the boxed areas corresponding to the DG area in the photomicrographs below. (B, C) Photomicrographs showing BrdU+ cells in horizontal sections throughout the extent of the dorso-ventral DG, derived from (B) CON and (C) RUN mice. (D) Dorsal to ventral distribution of BrdU+ cells throughout the extent of the DG in CON (n = 5) and RUN (n = 5) mice. Running significantly increases the number of BrdU+ cells in the dorsal DG (CON, 2932 ± 521 vs RUN, 6694 ± 1180; t(8) = 2.61, P < 0.03) and middle DG (CON, 535 ± 105 vs RUN, 1138 ± 194; _t_(8) = 2.44, _P_ < 0.04), but not the ventral DG (CON, 439 ± 76 vs RUN, 515 ± 51; _t_(8) = 0.74, _P_ > 0.47) DG. Data are means ± S.E.M. *P < 0.05.
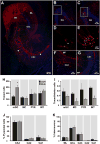
Fig. 3
Intra-hippocampal afferents to adult-born granule cells (GCs) are changed by running. (A) Horizontal section through the dentate gyrus (DG) and area CA3 derived from a runner mouse. Newborn starter cells (SC) express nuclear GFP and cytoplasmic MCh (green + red = yellow nuclei and red cytoplasm), whereas trans-synaptically traced cells (TC) express MCh only (red). Traced cells in the DG include mature granule cells (mGC), mossy cells (MC) and interneurons (INT). In area CA3, traced pyramidal cells (PYR) as well as INT (arrowheads) were observed. (B, C) Overview of DG in sections derived from (B) CON and (C) RUN mice showing traced mGC and SC. (D, E) High power photomicrographs showing traced mGC (red) closely associated with SC (yellow nuclei) in (D) CON and (E) RUN, corresponding to the boxed areas in (B) and (C), respectively. (F) Traced INT in area CA3. (G) PYR were observed in area CA1 and (A) area CA3. (H) Quantification of traced mGC, MC, CA3–CA1 PYR and INT providing input to SC in control (CON, n = 6) and runner (RUN, n = 7) mice. Only traced mGC number was significantly increased by running (t(11) = 3.17; P < 0.009). (I) Ratio of traced mGC, MC, PYR and INT to SC. The ratios of MC and INT to SC were significantly reduced by running (MC, _t_(11) = 4.14, _P_ < 0.002; INT, _t_(11) = 6.02, _P_ < 0.0001). (J) Percentage of traced PYR in areas CA3, CA2 and CA1 of the hippocampus. No difference was found between groups (_P_ > 0.05). (K) Percentage of traced INT distributed in the molecular layer of the DG (ML), GC layer (GCL), and areas CA3–CA1. No difference was found between groups (P > 0.05). Nuclei were stained with DAPI (blue). Data are means ± S.E.M. *P < 0.05.
Fig. 4
Mature GCs localized in the outer GCL (mGCs-OGCL) but not new GCs are strongly inhibited by running. (A) Example traces of whole cell patch-clamp recordings of mIPSCs from retrovirally-labeled new GCs in acute hippocampal slices derived from CON (black trace) and RUN (green trace) mice. (B) Representative mIPSCs traces from mGCs-OGCL from CON (gray trace) and RUN (blue trace) mice. (C) Summary bar graph for mean amplitude of mIPSCs from new GCs and mGCs-OGCL from CON and RUN groups. Two-way analysis of variance (ANOVA) showed that there is no interaction between GC type (new GC or mGC-OGCL) and housing (CON or RUN) condition (F(1,38) = 0.91, P > 0.34). There is a significant main effect of cell type (F(1,38) = 4.20, P < 0.05), indicating that mIPSC amplitude is higher in mGC-OGCL than in new GCs. (D, E) Cumulative probability plot of (D) new GCs and (E) mGCs-OGCL, mIPSCs inter-event interval in CON and RUN groups. (F) Summary bar graph for mean frequency of mIPSCs from new GCs and mGCs-OGCL. Two-way ANOVA revealed a significant interaction between cell type and housing condition (F(1,38) = 12.49, P < 0.001). Post-hoc comparisons showed that running significantly increased the frequency of mIPSCs of mGC-OGCL as compared to all other groups (P < 0.0002). New GCs: CON n = 12 cells from 3 mice, RUN n = 9 cells from 4 mice; mGC-OGCL: CON n = 10 cells from 3 mice, RUN n = 11 cells from 3 mice. Data are means ± S.E.M. *P < 0.05.
Fig. 5
Running modifies subcortical connections to new GCs. (A) Quantification of traced cells (TC) expressing MCh (red) localized in basal forebrain [diagonal band of Broca (DBB) and medial septum (MS)] from control (CON, n = 6) and runner (RUN, n = 7) mice. Running significantly increased MS TC number (t(11) = 5.12; P < 0.0003), but not DBB TC (t(11) = 1.57, P = 0.15). (B) Ratio of traced DBB cells to SC was reduced by running (t(11) = 2.83; P < 0.016), whereas the ratio of traced MS cells to SC was unchanged (t(11) = 1.36, P = 0.20). (C) Diagram of a horizontal section (adapted from Paxinos and Franklin, 2007). The inset shows the location of traced MS cells. (D, E) Photomicrographs of traced MS cells in sections derived from (D) CON and (E) RUN mice. (F) Quantification of TC localized in medial mammillary (MM) and supramammillary nucleus (SUM) pars lateralis from CON (n = 6) and RUN (n = 7) mice. Running significantly increased the number of traced MM (t(11) = 2.66; P < 0.02) and SUM cells (t(11) = 3.03; P < 0.01). (G) Ratio of traced SUM cells to SC was significantly increased by running (t(11) = 2.50; P < 0.03), whereas the ratio of traced MM cells to SC showed a trend towards an increase (t(11) = 2.16; #P = 0.053). (H) Diagram of a horizontal section (adapted from Paxinos and Franklin, 2007), inset shows the SUM. (I, J) Photomicrographs of sections showing traced SUM cells in sections derived from (I) CON and (J) RUN mice. SUML, supramammillary nucleus pars lateralis; SUMM, supramammillary nucleus pars medialis; IPF, interpeduncular fossa; IPR, interpeduncular nucleus; mt, mammillo-thalamic tract; SMT, sub-mammillo-thalamic nucleus. Nuclei were stained with DAPI (blue). Data are means ± S.E.M. *P < 0.05.
Fig. 6
Entorhinal cortex input to new GCs is reorganized by running. (A) Modified atlas plates (Paxinos and Franklin, 2007) corresponding to the photomicrographs of sections derived from (B) CON and (C) RUN mice. Upper atlas panels show the dorso-ventral horizontal section depth (distance from Bregma). The lower images show overviews of horizontal sections; shaded areas correspond to the photomicrographs below. (B, C) Photomicrographs showing traced cells (TC) in horizontal sections derived from (B) CON and (C) RUN mice. (D) The total number of TC in entorhinal–perirhinal cortex (EC–PRH) was increased by running (t(11) = 3.55, P < 0.004; CON _n_ = 6; RUN _n_ = 7). (E) Running did not alter the ratio of total EC–PRH TC to SC (_t_(11) = 0.69; _P_ = 0.5). (F) Within the EC, caudo-medial entorhinal cortex (CEnt), lateral entorhinal cortex (LEC), and medial entorhinal cortex (MEC) TC number was increased by running as compared to controls (CEnt, _t_(11) = 3.49, _P_ < 0.005; LEC, _t_(11) = 2.38, _P_ < 0.04; MEC, _t_(11) = 3.08, _P_ < 0.01). (G) Running did not alter the ratio of TC to SC in the peri- and entorhinal cortices (_P_ > 0.05). Data are means ± S.E.M. *P < 0.05. Abbreviations: parasubiculum (PaS); presubiculum (PrS).
Fig. 7
Running modifies glutamatergic synaptic transmission onto DG cells. (A, B) Representative mEPSCs traces from retrovirally labeled new GCs (A) and mGCs-OGCL (B) in acute hippocampal slices derived from CON and RUN mice [new GC: CON (black trace), RUN (green trace); mGCs-OGCL: CON (gray trace), RUN (blue trace)]. (C) Summary bar graph for mean amplitude of mEPSCs from new GCs (CON, n = 13 cells from 3 mice, RUN, n = 17 cells from 6 mice) and mGCs-OGCL (CON, n = 18 cells from 4 mice, RUN, n = 10 cells from 6 mice). Two-way ANOVA revealed a significant interaction between cell type and housing condition (F(1,54) = 13.22, P < 0.0006), but no main effect of cell type (_F_(1,54) = 0.19, _P_ > 0.89) or housing condition (F(1,54) = 0.18, P > 0.67). Running reduced the mean amplitude of mEPSCs in newborn GCs (P < 0.02), whereas the amplitude is increased in mGCs-OGCL (_P_ < 0.008). (D, E) Cumulative probability plot of (D) new GCs and (E) mGCs-OGCL mEPSC inter-event interval from CON and RUN groups. (F) Summary bar graph for mean frequency of mEPSCs from new GCs and mGCs-OGCL from CON and RUN mice. Two-way ANOVA revealed a significant interaction between cell type and housing condition (_F_(1,54) = 11.09, _P_ < 0.002) and a main effect of cell type (_F_(1,54) = 19.8, _P_ < 0.0001), but not of housing condition (_F_(1,54) = 2.18, _P_ > 0.15). Running significantly increased mEPSC frequency of mGCs-OGCL compared to all other groups (P < 0.02). (G) Schematic representation of the stimulation of the lateral (LPP) and medial (MPP) perforant pathway in the molecular layer (ML) of the DG and recordings from new GCs (green cell) and mGC-OGCL (blue cell). (H) Summary of paired pulse ratio (PPR) of EPSCs evoked at 50 ms inter-pulse interval by stimulation of LPP from new GCs (CON, _n_ = 6 cells from 5 mice, RUN _n_ = 8 cells from 5 mice), and mGCs-OGCL (CON, _n_ = 8 cells from 8 mice, RUN, _n_ = 10 cells from 8 mice). Two-way ANOVA showed no interaction between cell type and housing condition (_F_(1,28) = 1.88, _P_ > 0.18). There are significant main effects of housing condition (F(1,28) = 11.57, P < 0.002) and cell type (_F_(1,28) = 7.69, _P_ < 0.009). Running significantly increased paired-pulse facilitation onto new GCs compared to all other groups (_P_ < 0.004). (I) Summary of PPR of EPSCs evoked by stimulation of MPP from new GCs (CON, _n_ = 10 cells from 8 mice, RUN, _n_ = 7 cells from 4 mice) and mGCs-OGCL (CON, _n_ = 11 cells from 10 mice, RUN, _n_ = 6 cells from 4 mice). Two-way ANOVA showed no interaction between cell type and housing condition (_F_(1,30) = 0.92, _P_ > 0.35). There is a significant main effect of cell type (F(1,30) = 21.04, P < 0.0001), but not of housing condition (_F_(1,30) = 0.26, _P_ > 0.6). Data are means ± S.E.M. *P < 0.05.
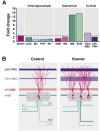
Fig. 8
Running-induced fold changes and model of the effects of running on the neuronal network of newborn GCs. (A) Running-induced fold changes in the newborn GCs (starter cells) and the synaptic inputs from intra-hippocampal, subcortical and cortical areas. Only medial mammillary (MM) and supramammillary (SUM) nuclei exceeded (~13-fold) the fold change of the starter cells (~3-fold). (B) Model showing the relative contribution of the regions that innervate new GCs under control and running conditions.
Similar articles
- Running throughout Middle-Age Keeps Old Adult-Born Neurons Wired.
Vivar C, Peterson B, Pinto A, Janke E, van Praag H. Vivar C, et al. eNeuro. 2023 May 22;10(5):ENEURO.0084-23.2023. doi: 10.1523/ENEURO.0084-23.2023. Print 2023 May. eNeuro. 2023. PMID: 37188520 Free PMC article. - Functional circuits of new neurons in the dentate gyrus.
Vivar C, van Praag H. Vivar C, et al. Front Neural Circuits. 2013 Feb 25;7:15. doi: 10.3389/fncir.2013.00015. eCollection 2013. Front Neural Circuits. 2013. PMID: 23443839 Free PMC article. Review. - Monosynaptic inputs to new neurons in the dentate gyrus.
Vivar C, Potter MC, Choi J, Lee JY, Stringer TP, Callaway EM, Gage FH, Suh H, van Praag H. Vivar C, et al. Nat Commun. 2012;3:1107. doi: 10.1038/ncomms2101. Nat Commun. 2012. PMID: 23033083 Free PMC article. - Running reorganizes the circuitry of one-week-old adult-born hippocampal neurons.
Sah N, Peterson BD, Lubejko ST, Vivar C, van Praag H. Sah N, et al. Sci Rep. 2017 Sep 7;7(1):10903. doi: 10.1038/s41598-017-11268-z. Sci Rep. 2017. PMID: 28883658 Free PMC article. - Adult neurogenesis. From circuits to models.
Wojtowicz JM. Wojtowicz JM. Behav Brain Res. 2012 Feb 14;227(2):490-6. doi: 10.1016/j.bbr.2011.08.013. Epub 2011 Aug 12. Behav Brain Res. 2012. PMID: 21893104 Review.
Cited by
- Entorhinal cortex-hippocampal circuit connectivity in health and disease.
Hernández-Frausto M, Vivar C. Hernández-Frausto M, et al. Front Hum Neurosci. 2024 Sep 20;18:1448791. doi: 10.3389/fnhum.2024.1448791. eCollection 2024. Front Hum Neurosci. 2024. PMID: 39372192 Free PMC article. Review. - Acute cycling exercise and hippocampal subfield function and microstructure in healthy older adults.
Callow DD, Kommula Y, Stark CEL, Smith JC. Callow DD, et al. Hippocampus. 2023 Oct;33(10):1123-1138. doi: 10.1002/hipo.23571. Epub 2023 Aug 1. Hippocampus. 2023. PMID: 37526119 Free PMC article. - Exercise Reshapes the Brain: Molecular, Cellular, and Structural Changes Associated with Cognitive Improvements.
Augusto-Oliveira M, Arrifano GP, Leal-Nazaré CG, Santos-Sacramento L, Lopes-Araújo A, Royes LFF, Crespo-Lopez ME. Augusto-Oliveira M, et al. Mol Neurobiol. 2023 Dec;60(12):6950-6974. doi: 10.1007/s12035-023-03492-8. Epub 2023 Jul 31. Mol Neurobiol. 2023. PMID: 37518829 Review. - Running throughout Middle-Age Keeps Old Adult-Born Neurons Wired.
Vivar C, Peterson B, Pinto A, Janke E, van Praag H. Vivar C, et al. eNeuro. 2023 May 22;10(5):ENEURO.0084-23.2023. doi: 10.1523/ENEURO.0084-23.2023. Print 2023 May. eNeuro. 2023. PMID: 37188520 Free PMC article. - Altered connectomes of adult-born granule cells following engraftment of GABAergic progenitors in the mouse hippocampus.
Arshad MN, Pinto A, van Praag H, Naegele JR. Arshad MN, et al. Prog Neurobiol. 2023 Jul;226:102450. doi: 10.1016/j.pneurobio.2023.102450. Epub 2023 Apr 13. Prog Neurobiol. 2023. PMID: 37061022 Free PMC article.
References
- Altman J, Das GD. Autoradiographic and histological evidence of postnatal hippocampal neurogenesis in rats. J Comp Neurol. 1965;124:319–335. - PubMed
- Amaral DG, Witter MP. The three-dimensional organization of the hippocampal formation: a review of anatomical data. Neuroscience. 1989;31:571–591. - PubMed
- Bergami M, et al. A critical period for experience-dependent remodeling of adult-born neuron connectivity. Neuron. 2015;85:710–717. - PubMed
- Blasco-Ibañez JM, Freund TF. Distribution, ultrastructure, and connectivity of calretinin-immunoreactive mossy cells of the mouse dentate gyrus. Hippocampus. 1997;7:307–320. - PubMed
Publication types
MeSH terms
LinkOut - more resources
Full Text Sources
Other Literature Sources
Medical


