Profiling tissue-resident T cell repertoires by RNA sequencing - PubMed (original) (raw)
Profiling tissue-resident T cell repertoires by RNA sequencing
Scott D Brown et al. Genome Med. 2015.
Abstract
Deep sequencing of recombined T cell receptor (TCR) genes and transcripts has provided a view of T cell repertoire diversity at an unprecedented resolution. Beyond profiling peripheral blood, analysis of tissue-resident T cells provides further insight into immune-related diseases. We describe the extraction of TCR sequence information directly from RNA-sequencing data from 6738 tumor and 604 control tissues, with a typical yield of 1 TCR per 10 million reads. This method circumvents the need for PCR amplification of the TCR template and provides TCR information in the context of global gene expression, allowing integrated analysis of extensive RNA-sequencing data resources.
Figures
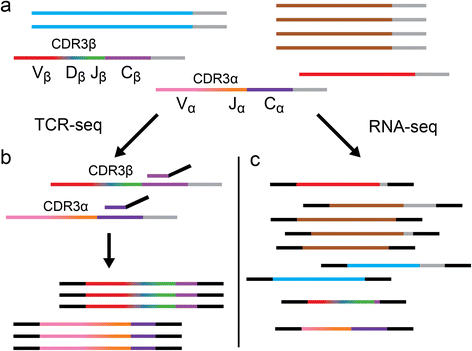
Fig. 1
Schematic representation of T cell receptor sequencing (TCR-seq) versus RNA sequencing. Horizontal lines represent mRNA transcripts with gray poly-A tails. Each color represents a unique gene sequence. a A pool of all mRNA in a sample is depicted, which contains irrelevant transcripts (blue, brown, and red) as well as recombined TCR transcripts (multi-colored). b TCR-seq involves selective amplification of the CDR3 region of TCR transcripts (displayed as a color gradient) by reverse transcription polymerase chain reaction (PCR) shown using a conserved C-gene primer (purple with black sequencing adapter tails) for the initial reverse transcription step and resulting, after PCR (not shown), in an enriched set of recombined TCR sequences. c RNA-seq employs shotgun sequencing, generating fragments from all transcripts present in the sample, which then have sequencing adapters ligated (black). The resulting sequencing library will contain fragments that, by chance, contain the CDR3 encoding sequence. Additionally, these libraries may contain fragments that share sequence similarity to recombined TCR sequences (e.g., the red transcript), potentially leading to false-positives
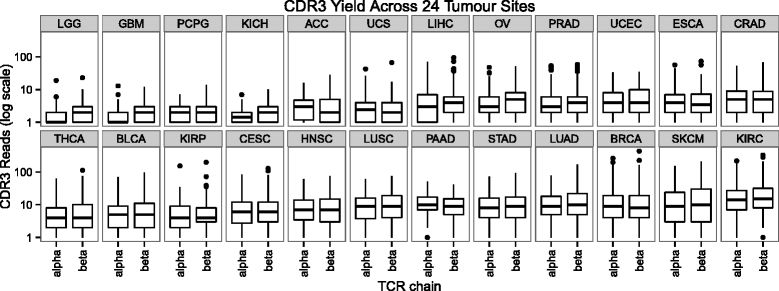
Fig. 2
The number of reads containing CDR3 sequences varies across tumor sites. ACC adrenocortical carcinoma, BLCA bladder urothelial carcinoma, BRCA breast invasive carcinoma, CESC cervical squamous cell carcinoma and endocervical adenocarcinoma, CRAD colon and rectum adenocarcinoma, ESCA esophageal carcinoma, GBM glioblastoma multiforme, HNSC head and neck squamous cell carcinoma, KICH kidney chromophobe, KIRC kidney renal clear cell carcinoma, KIRP kidney renal papillary cell carcinoma, LGG brain lower grade glioma, LIHC liver hepatocellular carcinoma, LUAD lung adenocarcinoma, LUSC lung squamous cell carcinoma, OV ovarian serous cystadenocarcinoma, PAAD pancreatic adenocarcinoma, PCPG pheochromocytoma and paraganglioma, PRAD prostate adenocarcinoma, SKCM skin cutaneous melanoma, STAD stomach adenocarcinoma, TCR T cell receptor, THCA thyroid carcinoma, UCEC uterine corpus endometrial carcinoma, UCS uterine carcinosarcoma
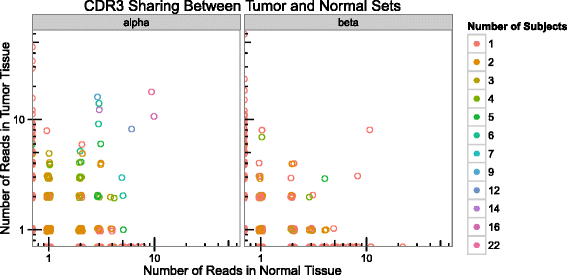
Fig. 3
The majority of CDR3s recovered from tumor/normal control tissue pairs are unique to tumor or normal tissue. For every CDR3, the number of reads in the set of tumors is plotted on the y-axis, with the number of reads in the set of normal samples on the x-axis. Circles are colored by the number of individuals in which that CDR3 sequence is detected
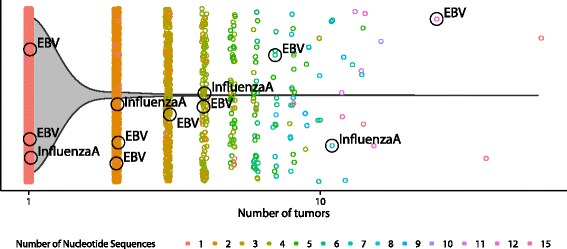
Fig. 4
Sharing of CDR3β sequences. All 49,672 CDR3β sequences derived from tumors are plotted along the x-axis according to the number of tumors they are found in. Color defines the number of nucleotide sequences that were found to generate the same CDR3β amino acid sequence. The violin plot overlay shows that most recovered CDR3β sequences are unique to an individual, though there is notable sharing (4.4 %) between individuals. Known public viral-specific CDR3β sequences [31] are labeled with their antigen specificity. EBV Epstein–Barr virus
Similar articles
- Rigorous benchmarking of T-cell receptor repertoire profiling methods for cancer RNA sequencing.
Peng K, Nowicki TS, Campbell K, Vahed M, Peng D, Meng Y, Nagareddy A, Huang YN, Karlsberg A, Miller Z, Brito J, Nadel B, Pak VM, Abedalthagafi MS, Burkhardt AM, Alachkar H, Ribas A, Mangul S. Peng K, et al. Brief Bioinform. 2023 Jul 20;24(4):bbad220. doi: 10.1093/bib/bbad220. Brief Bioinform. 2023. PMID: 37291798 Free PMC article. - T cell receptor repertoire usage in cancer as a surrogate marker for immune responses.
Schrama D, Ritter C, Becker JC. Schrama D, et al. Semin Immunopathol. 2017 Apr;39(3):255-268. doi: 10.1007/s00281-016-0614-9. Epub 2017 Jan 10. Semin Immunopathol. 2017. PMID: 28074285 Review. - Profiling model T-cell metagenomes with short reads.
Warren RL, Nelson BH, Holt RA. Warren RL, et al. Bioinformatics. 2009 Feb 15;25(4):458-64. doi: 10.1093/bioinformatics/btp010. Epub 2009 Jan 9. Bioinformatics. 2009. PMID: 19136549 - TCR repertoires of intratumoral T-cell subsets.
Linnemann C, Mezzadra R, Schumacher TN. Linnemann C, et al. Immunol Rev. 2014 Jan;257(1):72-82. doi: 10.1111/imr.12140. Immunol Rev. 2014. PMID: 24329790 Review. - Enriching and Characterizing T Cell Repertoires from 3' Barcoded Single-Cell Whole Transcriptome Amplification Products.
Jivanjee T, Ibrahim S, Nyquist SK, Gatter GJ, Bromley JD, Jaiswal S, Berger B, Behar SM, Love JC, Shalek AK. Jivanjee T, et al. Methods Mol Biol. 2022;2574:159-182. doi: 10.1007/978-1-0716-2712-9_7. Methods Mol Biol. 2022. PMID: 36087201 Free PMC article.
Cited by
- Single cell dynamics of tumor specificity vs bystander activity in CD8+ T cells define the diverse immune landscapes in colorectal cancer.
Borràs DM, Verbandt S, Ausserhofer M, Sturm G, Lim J, Verge GA, Vanmeerbeek I, Laureano RS, Govaerts J, Sprooten J, Hong Y, Wall R, De Hertogh G, Sagaert X, Bislenghi G, D'Hoore A, Wolthuis A, Finotello F, Park WY, Naulaerts S, Tejpar S, Garg AD. Borràs DM, et al. Cell Discov. 2023 Nov 15;9(1):114. doi: 10.1038/s41421-023-00605-4. Cell Discov. 2023. PMID: 37968259 Free PMC article. - An immunoinformatics assessment of the cancer testis antigen, DDX53, as a potential early esophageal cancer antigen.
Cheng P, Cios KJ, Varkhedi M, Barker VR, Yeagley M, Chobrutskiy A, Chobrutskiy BI, Blanck G. Cheng P, et al. Oncoscience. 2023 Nov 10;10:59-66. doi: 10.18632/oncoscience.590. eCollection 2023. Oncoscience. 2023. PMID: 37953875 Free PMC article. - Pan-cancer landscape of immunology PIWI-interacting RNAs.
Wan D, Li R, Huang H, Zhu X, Li G. Wan D, et al. Comput Struct Biotechnol J. 2023 Oct 21;21:5309-5325. doi: 10.1016/j.csbj.2023.10.042. eCollection 2023. Comput Struct Biotechnol J. 2023. PMID: 37941657 Free PMC article. - IGL CDR3 Hydropathy and Antigen Chemical Complementarity Associated with Greater Disease-Free Survival in Lung Adenocarcinoma: Implications for Gender Disparities.
Charkowick SV, Huda TI, Patel DN, Yeagley M, Arturo JF, Cios KJ, Gozlan EC, Chobrutskiy A, Chobrutskiy BI, Blanck G. Charkowick SV, et al. Biochem Genet. 2024 Feb;62(1):530-546. doi: 10.1007/s10528-023-10437-2. Epub 2023 Jul 1. Biochem Genet. 2024. PMID: 37392243 - Identification of antigenic epitopes recognized by tumor infiltrating lymphocytes in high grade serous ovarian cancer by multi-omics profiling of the auto-antigen repertoire.
Millar DG, Yang SYC, Sayad A, Zhao Q, Nguyen LT, Warner K, Sangster AG, Nakatsugawa M, Murata K, Wang BX, Shaw P, Clarke B, Bernardini MQ, Pugh T, Thibault P, Hirano N, Perreault C, Ohashi PS. Millar DG, et al. Cancer Immunol Immunother. 2023 Jul;72(7):2375-2392. doi: 10.1007/s00262-023-03413-7. Epub 2023 Mar 21. Cancer Immunol Immunother. 2023. PMID: 36943460 Free PMC article.
References
- Sato E, Olson SH, Ahn J, Bundy B, Nishikawa H, Qian F, et al. Intraepithelial CD8+ tumor-infiltrating lymphocytes and a high CD8+/regulatory T cell ratio are associated with favorable prognosis in ovarian cancer. Proc Natl Acad Sci U S A. 2005;102:18538–43. doi: 10.1073/pnas.0509182102. - DOI - PMC - PubMed
Publication types
MeSH terms
Substances
LinkOut - more resources
Full Text Sources
Other Literature Sources


