Sex beyond the genitalia: The human brain mosaic - PubMed (original) (raw)
. 2015 Dec 15;112(50):15468-73.
doi: 10.1073/pnas.1509654112. Epub 2015 Nov 30.
Zohar Berman 2, Ido Tavor 3, Nadav Wexler 4, Olga Gaber 5, Yaniv Stein 4, Nisan Shefi 6, Jared Pool 7, Sebastian Urchs 7, Daniel S Margulies 7, Franziskus Liem 8, Jürgen Hänggi 9, Lutz Jäncke 9, Yaniv Assaf 10
Affiliations
- PMID: 26621705
- PMCID: PMC4687544
- DOI: 10.1073/pnas.1509654112
Sex beyond the genitalia: The human brain mosaic
Daphna Joel et al. Proc Natl Acad Sci U S A. 2015.
Abstract
Whereas a categorical difference in the genitals has always been acknowledged, the question of how far these categories extend into human biology is still not resolved. Documented sex/gender differences in the brain are often taken as support of a sexually dimorphic view of human brains ("female brain" or "male brain"). However, such a distinction would be possible only if sex/gender differences in brain features were highly dimorphic (i.e., little overlap between the forms of these features in males and females) and internally consistent (i.e., a brain has only "male" or only "female" features). Here, analysis of MRIs of more than 1,400 human brains from four datasets reveals extensive overlap between the distributions of females and males for all gray matter, white matter, and connections assessed. Moreover, analyses of internal consistency reveal that brains with features that are consistently at one end of the "maleness-femaleness" continuum are rare. Rather, most brains are comprised of unique "mosaics" of features, some more common in females compared with males, some more common in males compared with females, and some common in both females and males. Our findings are robust across sample, age, type of MRI, and method of analysis. These findings are corroborated by a similar analysis of personality traits, attitudes, interests, and behaviors of more than 5,500 individuals, which reveals that internal consistency is extremely rare. Our study demonstrates that, although there are sex/gender differences in the brain, human brains do not belong to one of two distinct categories: male brain/female brain.
Keywords: behavior; brain connectivity; brain structure; gender differences; sex differences.
Conflict of interest statement
The authors declare no conflict of interest.
Figures
Fig. 1.
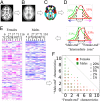
Assessing internal consistency in the human brain. (A) T1-weighted images were normalized and segmented using (B) the MNI template. (C) Voxels were mapped into 116 regions according to the AAL atlas. (D) The distribution of the gray matter volume in females (red) and males (green) of two of the region showing the largest sex/gender differences [left hippocampus (Upper) and left caudate (Lower)]. A continuous color representation of the degree of “maleness” and “femaleness” was created separately for each of the 10 regions showing the largest sex/gender difference. Volumes falling in the “intermediate” zone are colored in white; volumes in the “male-end” and in the “female-end” zones are colored using continuous blue-white and pink-white scales, respectively. (E) The degree of “maleness-femaleness” of each region for each female (Left) and male (Right). Each horizontal line represents the brain of one subject and each column represents a single brain region. The number above each column corresponds to the region’s number in the AAL atlas and in Table S1. (F) A bivariate scattergram (created using the Matplotlib library of Python) of the number of regions at the “female-end” (x axis) and at the “male-end” (y axis) in females (red) and males (green). The number of regions at the “intermediate” zone is not depicted because the number of “male-end”, “intermediate”, and “female-end” features always adds up to the number of features included in the analysis (which is the highest value on the x and y axes of the graph). The size of each circle is proportional to the percent of individuals from the same sex/gender category with an identical score on the two measures.
Fig. S1.
Hypothetical distributions of “male-end” and “female-end” scores under different degrees of internal consistency. A bivariate scattergram of the number of regions at the “female-end” (x axis) and at the “male-end” (y axis) in females (red) and males (green) under (A) perfect internal consistency; (B–D) different degrees of noise (B) ±2,500, (C) ±3,333, (D) ±5,000; and (E) no internal consistency (see SI Methods and SI Results for details).
Fig. 2.
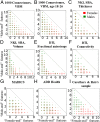
Distributions of “female-end” and “male-end” features in females and males. Bivariate scattergrams of the number of features at the “female-end” (x axis) and at the “male-end” (y axis) in females (red) and males (green) in the 1000 Functional Connectomes Project sample, VBM analysis (A), subsample of the 18–26 y olds from the 1000 Functional Connectomes Project sample, VBM analysis (B), the NKI, SBA, cortical thickness (C), and volume of cortical, subcortical, and white matter regions (D), the University of Zurich DTI data, fractional anisotropy (E) and connectivity (F), MADICS sample (G), ADD Health sample (H), and Carothers and Reis’s sample (I). The size of each circle is proportional to the percent of individuals from the same sex/gender category with an identical score on the two measures.
Fig. S2.
The human gender mosaic. A color representation of the degree of femininity-masculinity [pink (“female-end”) – white (“intermediate”) – blue (“male-end”)] of the variables showing the largest sex/gender differences in the (A) MADICS sample and (B) Carother and Reis’ sample. The pink-white-blue scales were created as in Fig. 2_D_. Each line is a subject and each column is a single characteristic. The order of columns from left to right is the same as the order of variables in Table S5.
Fig. 3.
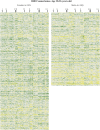
The human brain mosaic. The gray matter volume of all 116 regions of gray matter in females (Left) and in males (Right) from the first sample is represented using a continuous high-low (green-white-yellow) scale. Each horizontal line represents the brain of a single subject and each column represents a single brain region. The continuous high-low scale represents the relative volume of a brain region in a given brain relative to the volume of this brain region in all other brains (i.e., within a column). The regions that showed the largest sex/gender differences and were included in the internal consistency analysis are marked with a black bar. The number above each bar corresponds to the region’s number in the AAL atlas and in Table S1. (Inset) Magnification of a small part of a horizontal line (i.e., a single brain). The number in each colored cell is the volume of this region for this brain.
Fig. S3.
The human brain mosaic. The gray matter volume of all 116 regions of gray matter in females (Left) and in males (Right) from the subsample of the 18–26 y olds from the 1000 Functional Connectomes Project sample is represented using a continuous high-low (green-white-yellow) scale, created as in Fig. 3. Each horizontal line represents the brain of a single subject and each column represents a single brain region. The regions that showed the largest sex/gender differences and were included in the internal consistency analysis are marked with a black bar. The number above each bar corresponds to the region’s number in the AAL atlas and in Table S1.
Fig. S4.
The human brain mosaic. The absolute volume of 68 cortical regions, 23 subcortical regions, and 77 regions of white matter in females (Upper) and males (Lower) is represented using a continuous high-low (green-white-yellow) scale, created as in Fig. 3. The brains of both groups are separated into large (“male-end”), “intermediate”, and small (“female-end”), according to total brain volume, to foster the appreciation of size effects and of sex/gender effects. Each horizontal line represents the brain of a single subject and each column represents a single brain region. The regions that showed the largest sex/gender differences and were included in the internal consistency analysis are marked with a black bar. The number above each bar corresponds to the region’s number in Table S3.
Comment in
- Reply to Glezerman: Why differences between brains of females and brains of males do not "add up" to create two types of brains.
Joel D, Hänggi J, Pool J. Joel D, et al. Proc Natl Acad Sci U S A. 2016 Apr 5;113(14):E1972. doi: 10.1073/pnas.1600791113. Epub 2016 Mar 8. Proc Natl Acad Sci U S A. 2016. PMID: 26957593 Free PMC article. No abstract available. - Yes, there is a female and a male brain: Morphology versus functionality.
Glezerman M. Glezerman M. Proc Natl Acad Sci U S A. 2016 Apr 5;113(14):E1971. doi: 10.1073/pnas.1524418113. Epub 2016 Mar 8. Proc Natl Acad Sci U S A. 2016. PMID: 26957594 Free PMC article. No abstract available. - Patterns in the human brain mosaic discriminate males from females.
Chekroud AM, Ward EJ, Rosenberg MD, Holmes AJ. Chekroud AM, et al. Proc Natl Acad Sci U S A. 2016 Apr 5;113(14):E1968. doi: 10.1073/pnas.1523888113. Epub 2016 Mar 16. Proc Natl Acad Sci U S A. 2016. PMID: 26984491 Free PMC article. No abstract available. - Multivariate revisit to "sex beyond the genitalia".
Rosenblatt JD. Rosenblatt JD. Proc Natl Acad Sci U S A. 2016 Apr 5;113(14):E1966-7. doi: 10.1073/pnas.1523961113. Epub 2016 Mar 16. Proc Natl Acad Sci U S A. 2016. PMID: 26984492 Free PMC article. No abstract available. - Joel et al.'s method systematically fails to detect large, consistent sex differences.
Del Giudice M, Lippa RA, Puts DA, Bailey DH, Bailey JM, Schmitt DP. Del Giudice M, et al. Proc Natl Acad Sci U S A. 2016 Apr 5;113(14):E1965. doi: 10.1073/pnas.1525534113. Epub 2016 Mar 16. Proc Natl Acad Sci U S A. 2016. PMID: 26984493 Free PMC article. No abstract available.
Similar articles
- Investigating the differential contributions of sex and brain size to gray matter asymmetry.
Kurth F, Thompson PM, Luders E. Kurth F, et al. Cortex. 2018 Feb;99:235-242. doi: 10.1016/j.cortex.2017.11.017. Epub 2017 Dec 6. Cortex. 2018. PMID: 29287244 Free PMC article. - Beyond sex differences and a male-female continuum: Mosaic brains in a multidimensional space.
Joel D. Joel D. Handb Clin Neurol. 2020;175:13-24. doi: 10.1016/B978-0-444-64123-6.00002-3. Handb Clin Neurol. 2020. PMID: 33008521 Review. - Regional volumes and spatial volumetric distribution of gray matter in the gender dysphoric brain.
Hoekzema E, Schagen SE, Kreukels BP, Veltman DJ, Cohen-Kettenis PT, Delemarre-van de Waal H, Bakker J. Hoekzema E, et al. Psychoneuroendocrinology. 2015 May;55:59-71. doi: 10.1016/j.psyneuen.2015.01.016. Epub 2015 Jan 30. Psychoneuroendocrinology. 2015. PMID: 25720349 - Gender differences in brain structure and resting-state functional connectivity related to narcissistic personality.
Yang W, Cun L, Du X, Yang J, Wang Y, Wei D, Zhang Q, Qiu J. Yang W, et al. Sci Rep. 2015 Jun 25;5:10924. doi: 10.1038/srep10924. Sci Rep. 2015. PMID: 26109334 Free PMC article. - Double duty for sex differences in the brain.
De Vries GJ, Boyle PA. De Vries GJ, et al. Behav Brain Res. 1998 May;92(2):205-13. doi: 10.1016/s0166-4328(97)00192-7. Behav Brain Res. 1998. PMID: 9638962 Review.
Cited by
- Epistemic Injustice in Brain Studies of (Trans)Gender Identity.
Llaveria Caselles E. Llaveria Caselles E. Front Sociol. 2021 Mar 26;6:608328. doi: 10.3389/fsoc.2021.608328. eCollection 2021. Front Sociol. 2021. PMID: 33869551 Free PMC article. - The effect of colour on reading performance in children, measured by a sensor hub: From the perspective of gender.
Jakovljević T, Janković MM, Savić AM, Soldatović I, Mačužić I, Jakulin TJ, Papa G, Ković V. Jakovljević T, et al. PLoS One. 2021 Jun 14;16(6):e0252622. doi: 10.1371/journal.pone.0252622. eCollection 2021. PLoS One. 2021. PMID: 34125863 Free PMC article. - The NIMH Intramural Longitudinal Study of the Endocrine and Neurobiological Events Accompanying Puberty: Protocol and rationale for methods and measures.
Cole KM, Wei SM, Martinez PE, Nguyen TV, Gregory MD, Kippenhan JS, Kohn PD, Soldin SJ, Nieman LK, Yanovski JA, Schmidt PJ, Berman KF. Cole KM, et al. Neuroimage. 2021 Jul 1;234:117970. doi: 10.1016/j.neuroimage.2021.117970. Epub 2021 Mar 24. Neuroimage. 2021. PMID: 33771694 Free PMC article. - Genetic architecture of the white matter connectome of the human brain.
Sha Z, Schijven D, Fisher SE, Francks C. Sha Z, et al. Sci Adv. 2023 Feb 17;9(7):eadd2870. doi: 10.1126/sciadv.add2870. Epub 2023 Feb 17. Sci Adv. 2023. PMID: 36800424 Free PMC article. - Oxytocin-mediated social enrichment promotes longer telomeres and novelty seeking.
Faraji J, Karimi M, Soltanpour N, Moharrerie A, Rouhzadeh Z, Lotfi H, Hosseini SA, Jafari SY, Roudaki S, Moeeini R, Metz GA. Faraji J, et al. Elife. 2018 Nov 13;7:e40262. doi: 10.7554/eLife.40262. Elife. 2018. PMID: 30422111 Free PMC article.
References
- Richardson SS. Sex Itself: The Search for Male and Female in the Human Genome. Univ of Chicago Press; Chicago: 2013.
- Schiebinger L (1989) The Mind Has No Sex?: Women in the Origins of Modern Science (Harvard Univ Press, Cambridge, MA) - PubMed
Publication types
MeSH terms
LinkOut - more resources
Full Text Sources
Other Literature Sources


